Long Term Financial Strategy - Part II
BdIAS (Breadth driven Investment Allocation Strategy) approach guidelines
Follow the steps -
- Market Timing - Is this right time to enter/exit market ?
- Funds Ranking - Identify who are the top 3 runners !
- Re-allocate portfolio based on situation/scenario
- Monitor Portfolio - Ongoing process to avoid financial crash and/or pitfalls
Step 1 - Is this the right time to enter/exit market ?
How to know if I should be in the market or on the sidelines?
As mentioned earlier we will use BPNYA indicator to tell us probable market direction and danger zones.
Simple things to remember:
As mentioned earlier we will use BPNYA indicator to tell us probable market direction and danger zones.
Simple things to remember:
- Anytime BPNYA Index is above 70 then its time to sell or, be on the side lines, which means be in cash or move your money to money market fund
- Anytime BPNYA Index is below 30 then its time to buy or, be ready to enter the market

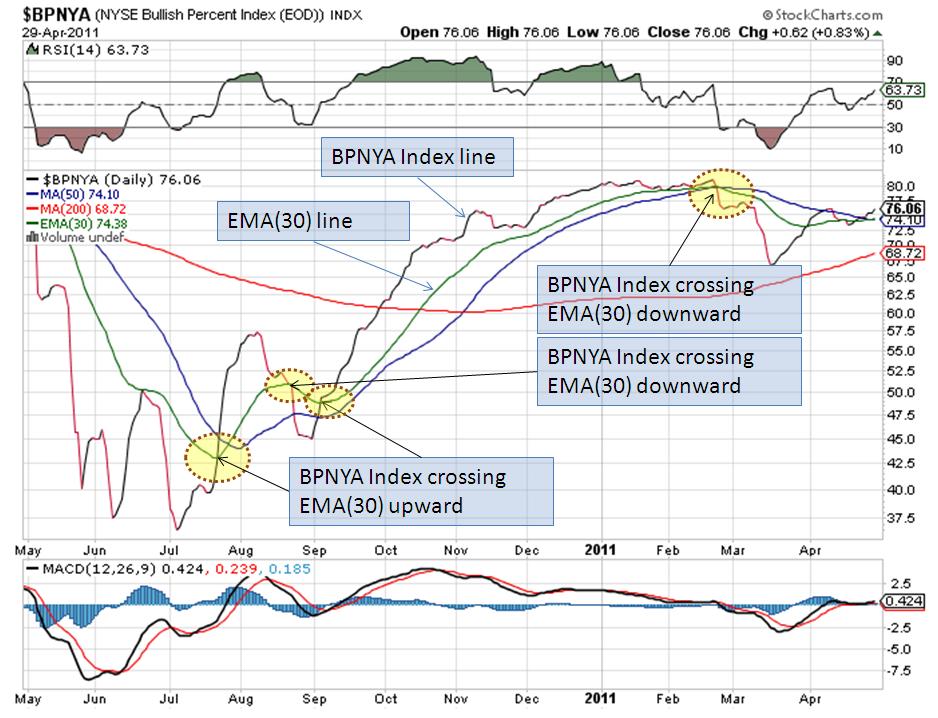
BPNYA Index Chart
Is there a entry/exit signal !!!
Click here to see FULL size Chart.
Where can I get BPNYA Index chart?
You can find it here
- We consider a entry/exit based on every time BPNYA Index crosses EMA(30), let's take a look at this example.
- Our point of interest is in the junction when BPNYA Index crosses EMA(30), depending on the condition - if the crossing happened while BPNYA moving upward or downward we determine if its time to get in the market or get out of the market.
- We also consider EMA(30) position relative to SMA(50) (line in blue) & SMA(200) (line in red) to guide us if market is acting bit trickier.
Click here to see FULL size Chart.
Where can I get BPNYA Index chart?
You can find it here
This is DAMN CONFUSING!!!
Not to worry, the information provided above is just for your basic understanding. We are not deriving market timing from any proprietary indicator but general public information available to all. The GOOD NEWS is that we have developed a tool for you which will provide you entry and exit signals based on your input, SOUNDS EASY!!!
All you need to do is following:
- Check out the latest BPNYA Chart from the link above
- Enter information in the tool which will then provide you with the market signal
- If you are not sure how to read the chart, you can choose to follow our BLOG where we summarize market conditions once every week.
Step 2 - How to find which are the TOP 3 Funds in the ranking ?
Use the spreadsheet (from download section in next part) and follow the directions. The spreadsheet will calculate ranking for all the selected funds which in turn will provide you with 3 TOP ranked Funds based on your selection.
Things to remember:
Mutual Funds - Use ranking by 21 days relative strength & 1 day of recent data
ETF - Use ranking by 63 days relative strength and 7 days of recent data
You can find more information on how to setup spreadsheet here.
Things to remember:
- Exclude target date funds or bond funds from your 401K, 529 Plan or HSA choices & enter rest of Mutual Fund Symbols (available to you from your employer,broker,etc) in the spreadsheet.
- If you have Traditional IRA & Roth IRA with any brokerage firm then typically you have plenty of investment options such as Mutual Funds, ETFs, Stocks, etc. You can use this techniques for Mutual Funds & ETFs. However, do not mix Mutual Funds with ETFs in the same spreadsheet as it may give mixed results. You can download the spreadsheet for Mutual Funds and ETFs separately, however the logic remains same.
- You can enter 401K Mutual Funds for your entire family in same spreadsheet and use Tag column to sort them accordingly.
Mutual Funds - Use ranking by 21 days relative strength & 1 day of recent data
ETF - Use ranking by 63 days relative strength and 7 days of recent data
You can find more information on how to setup spreadsheet here.
Step 3 - When to re-allocate my portfolio ?
Scenarios:
1. Market timing showing SELL signal
Move your money to Money Market Fund to avoid market drop, in short lock in your profits
2. Market timing showing Buy signal
Move your money from Money Market Fund to any/all TOP 3 ranked Funds so that your money grows and you do not miss out the market rally.
3. My chosen Fund is not in the TOP 3 ranked Funds anymore
If such a situation occurs then it means your chosen horse is not as fast as others but nonetheless it is running in right direction. The choice is yours
to either retain the Fund or move money from that fund to any TOP 3 ranked Funds at that point in time.
4. My chosen Fund is going down v/s the Market, however it is still in the Top 3 ranked Funds
The model has in-built trigger to show SELL signal for individual Funds if they go down beyond a certain threshold to protect your money by cutting
down losses. If the SELL signal is triggered then close the position in that Fund and chose another best runner from Top 3.
Step 4 - Monitor my portfolio
Why should I monitor? I mean can't I allocate my portfolio to TOP 3 ranked Funds and forget!!!
How often should I monitor my portfolio?
- Think of last time you forgot your portfolio allocation and what happened in 2008 financial crisis! Many people lost almost 30-50% of their retirement savings.
- Lazy portfolio = poor returns
- Lets go back to our example: In a Derby (horse race), does same horse win the race every time? We don't think so... Similarly, today's financial markets are very dynamic and global. If you want to secure your financial future then take control of your portfolio and finances.
- The fact is you need to guard your money and not rely on news channels/financial advisers/TV programs/others/etc.
How often should I monitor my portfolio?
- Depending on your comfort level you can decide your monitoring interval.
- Considering today's Financial Markets and Global influences, we would monitor at least every week or two.
- Remember, monitoring does not mean you re-allocate your portfolio every week, all it means is if you sense any danger then protect your money or else let it ride the wave.
- Typically, before any major crash or crisis, markets give enough warning signs of danger zone which are clues for us to avoid danger.
