|
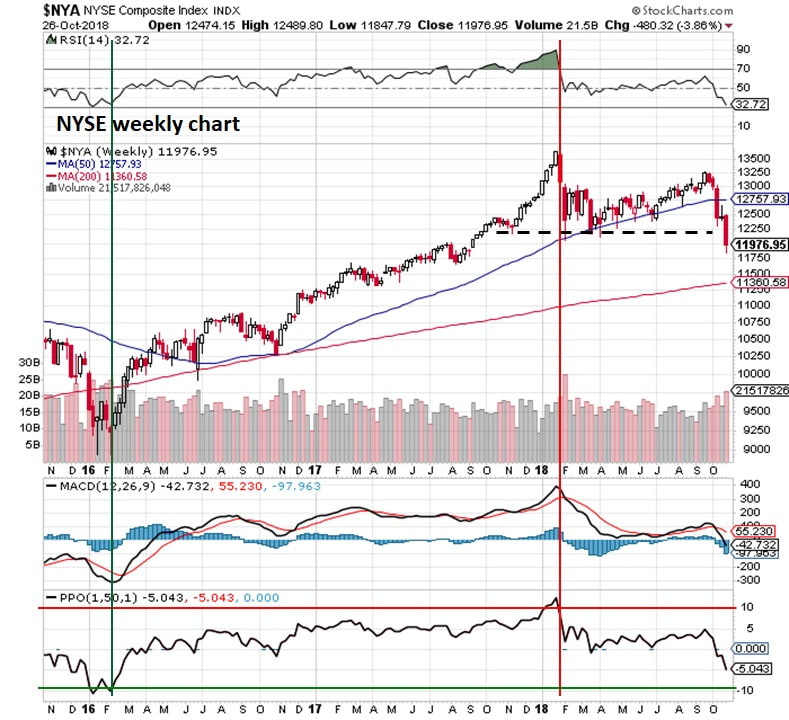
Market experienced its worse free fall since last February and spooked everyone. When will we find a possible bottom? Are there any ways to identify potential bottom in near term? Let's take a look... Take a look at below NYSE daily chart, observe yellow circled areas. RSI is in oversold territory suggesting a potential bounce in coming weeks ahead. Similarly, any time PPO is near -5 area, market tends to bottom in near term and potential bounce can be expected in coming weeks.  Check out weekly NYSE chart below and observe it with respect to RSI and PPO:
 Below chart is a market breadth chart known as NYSE McClellan Oscillator, check out the arrows. A potential bounce can be expected for next 2 weeks.  Below chart is a market breadth chart known as NASDAQ McClellan Summation Index (weekly chart), observe yellow circled areas. Again a potential bounce can be expected in near term.  Based on emerging pattern and story presented by charts, we believe that this decline may have been over done for now and undergo a bounce for next 2 weeks. However, based on the election outcome and other global events, market may decide on further direction.
Get ready for a bounce in near term... Comments are closed.
|
What is NYUD?
What is BPNYA?Archives
January 2020
Categories
All
|
 RSS Feed
