|
Market is NOT able to break through the resistance formed by earlier HIGH. Will the year end rally gain enough traction or will this rally fizzle out!!! What can we expect based on the charts? BPNYA is above EMA(30) while Volatility ($VIX) appears to be at the lowest levels, even in these conditions market is finding it difficult to rally decisively. 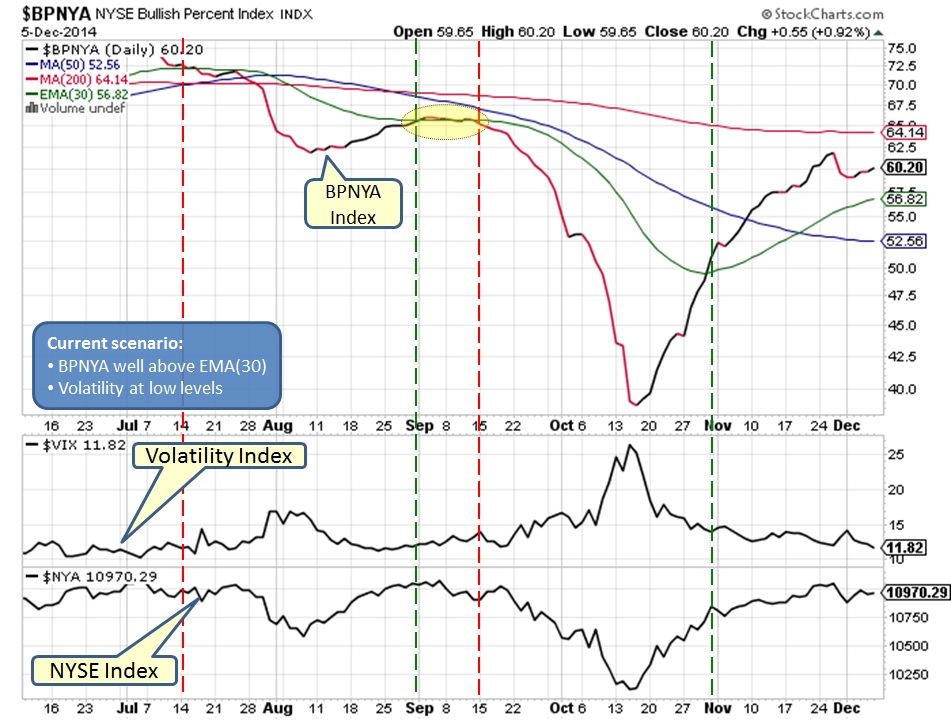
NYSE daily chart shows resistance formed by earlier HIGH. RSI is still above 50 mark giving benefit of doubt to BULLs while MACD has crossed over giving mixed signal. Market might spend more time in a range between resistance at earlier HIGH and MA(200). 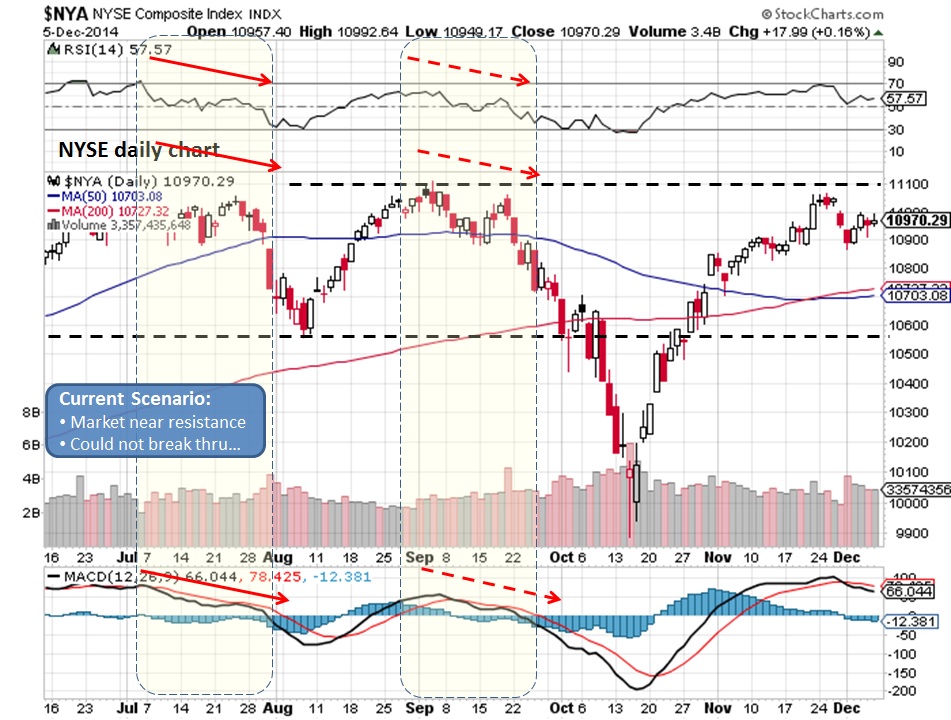
Weekly NYSE chart clearly shows a triple top formation which is considered bearish. RSI is also showing divergence in comparison to price and same can be seen by MACD. All signs suggesting possible pressure on the market and this rally might fizzle out. 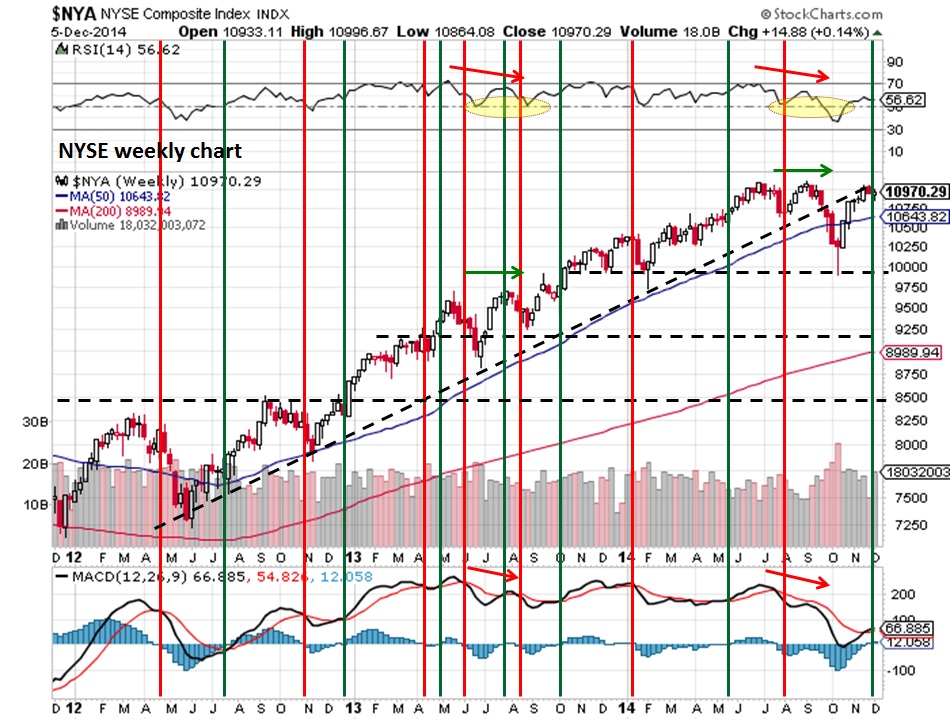
NYUD was also NOT able to penetrate earlier HIGH forming triple top pattern along with RSI trending downwards. However for now RSI is above 50 mark giving benefit of doubt to BULLs. 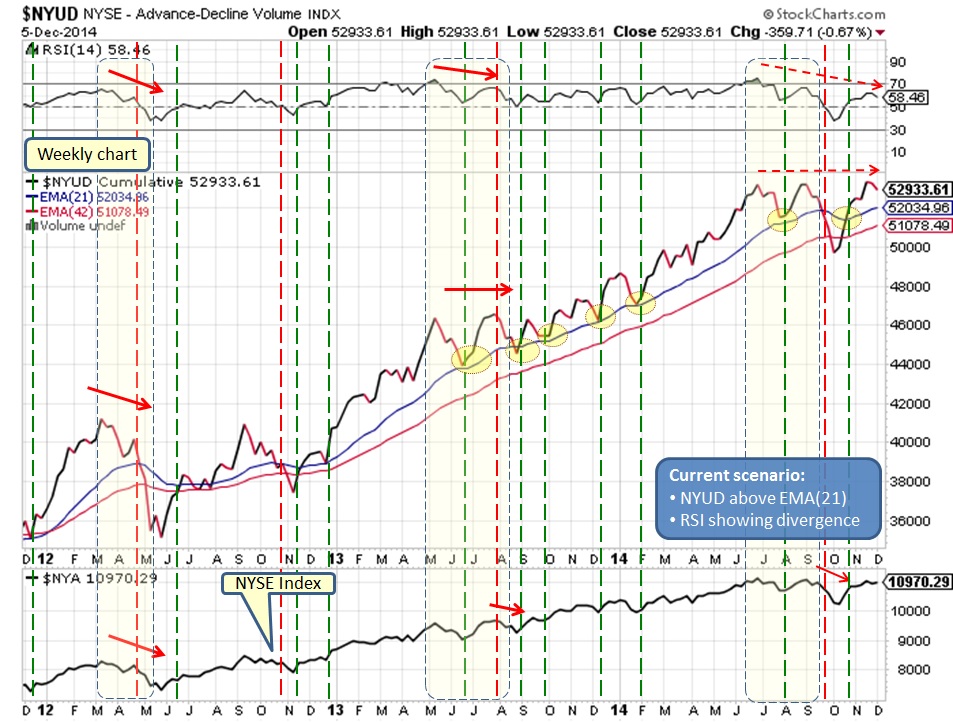
Based on the charts, it appears that market might make a final attempt to marginally breach the earlier HIGH to lure more people into market near the TOP and then take a U-turn for good. For now the benefit of doubt goes to BULLs.
12/8/2014 08:34:21 pm
Nifty have strong support at 8300b after breaking this support level it will show the level of 8100. Comments are closed.
|
What is NYUD?
What is BPNYA?Archives
January 2020
Categories
All
|
 RSS Feed
