|
As expected, Market is finding difficult to hold its ground. But will this pullback convert into severe correction or remain contained!!! Lets find out if charts are providing any valuable clues... BPNYA well below 70 mark as well as below EMA(30). As expected, earlier BUY trigger was a trap which is confirmed by pullback in the market along with rising Volatility ($VIX). 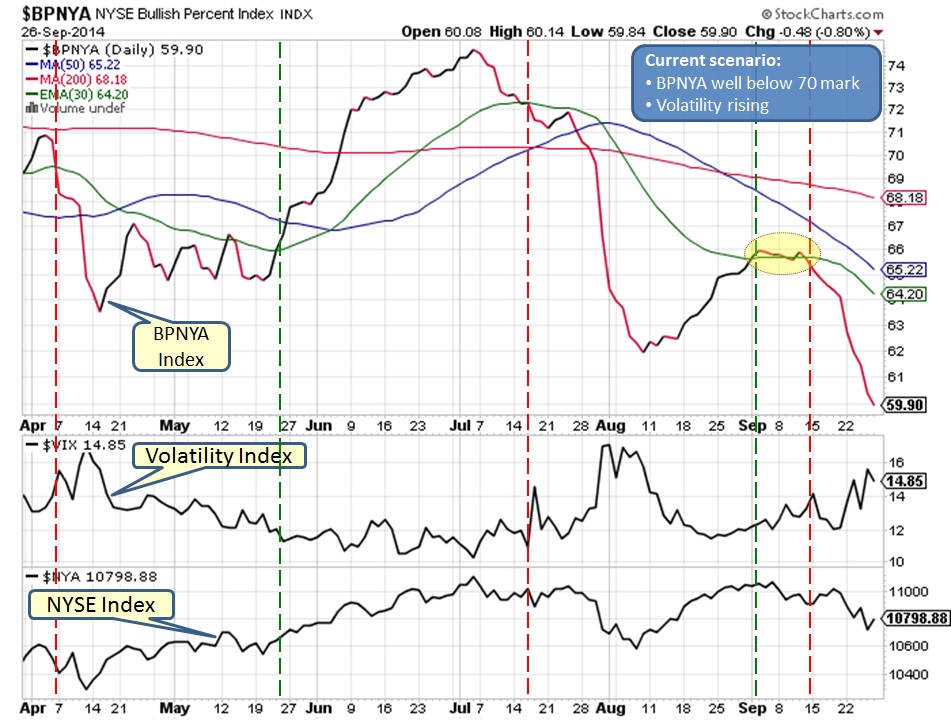
NYSE could not hold onto MA(50) support and is racing towards MA(200) support near 10,600 area. Appears to be very similar setup as previous one in July! 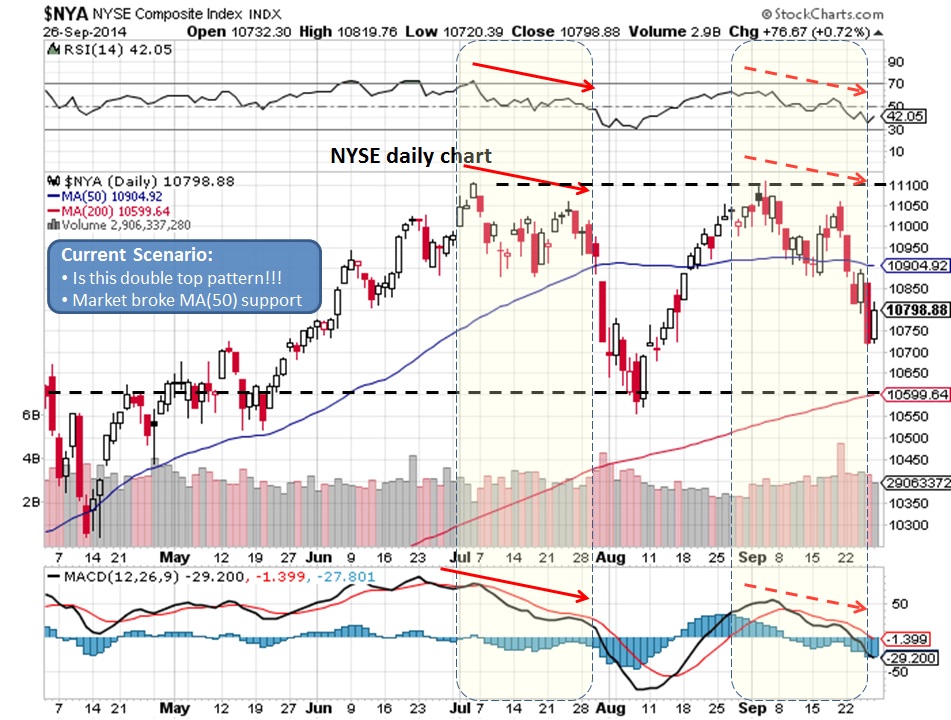
Weekly chart is the one to watch, BUT WHY? Watch, the clearly visible double TOP pattern hitting against current trend line (shown by dotted line), RSI trending down yet above 50 and MACD trending down as well. As long as RSI stays above 50, this market can turn around otherwise the current divergences will show its effect. 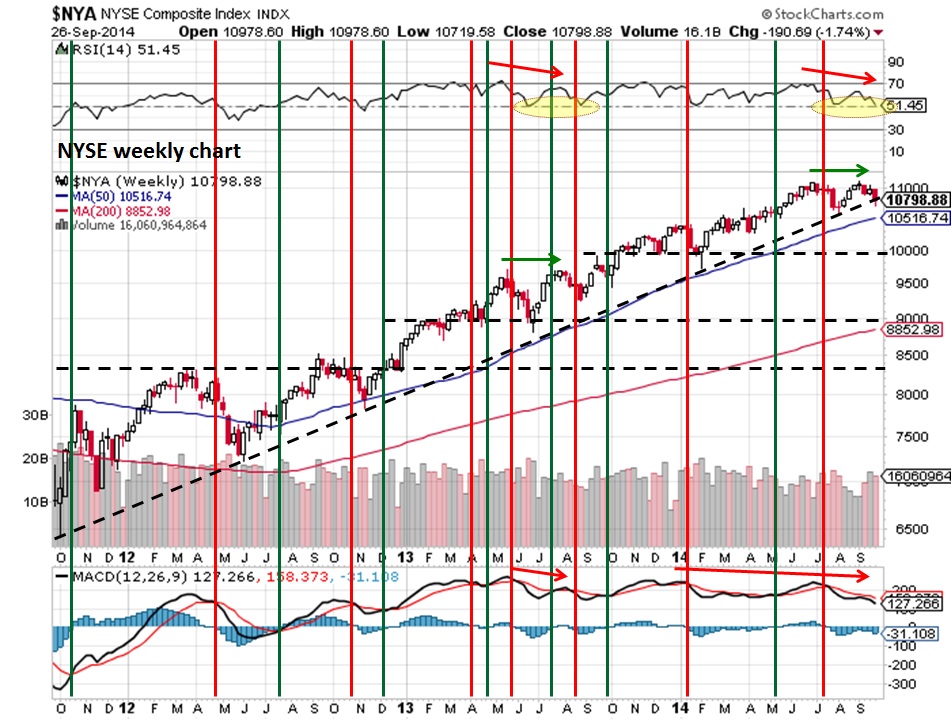
NYUD is pulled back towards EMA(21) and RSI is also very close to 50. As long as, both stays above their respective lines, this market has a chance to bounce else the BULL trend could be jeopardized. 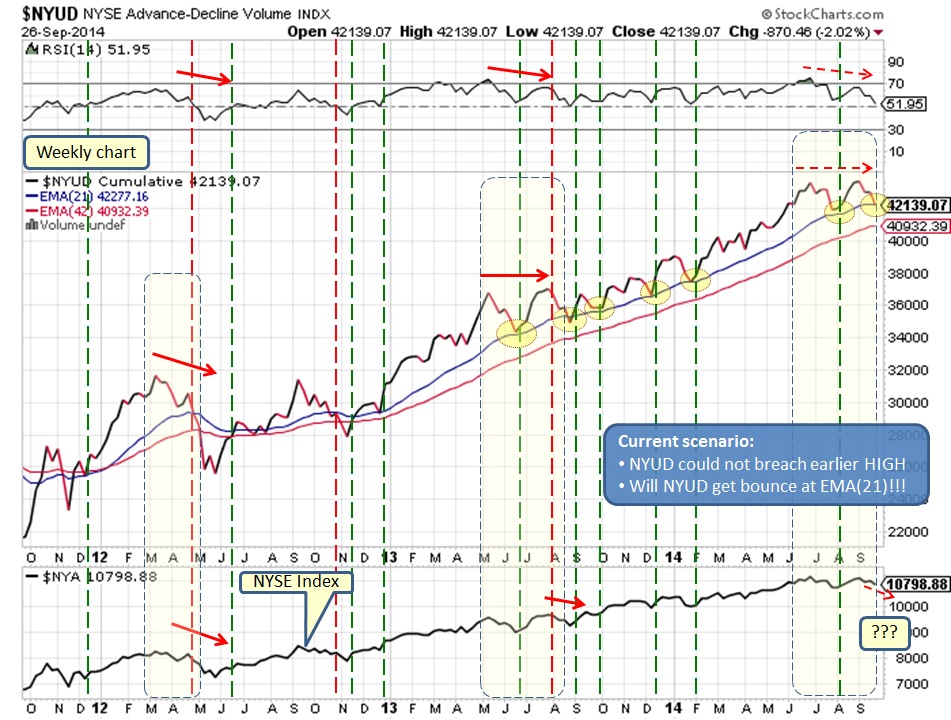
Charts are telling us to be cautious, earnings season is two weeks away. We might get a gradual drag until earnings season is here when we might get a bounce based on outcomes, all this is under the assumption that no major geo-political news drags the market down in a shock. We might see a long and stretched topping pattern going forward we lot of mixed signals, hence be cautious and alert.
What does it mean for our Investments?
Market in pullback with further downside possible... Comments are closed.
|
What is NYUD?
What is BPNYA?Archives
January 2020
Categories
All
|
 RSS Feed
