|
Market is undergoing bounce as expected, however the magnitude and sustainability remains to be seen. Key is to understand if bottom is behind us OR more pain to come!!! Nothing changed in below chart, however volatility is dancing around 20 mark. Watch out for a possible spike. 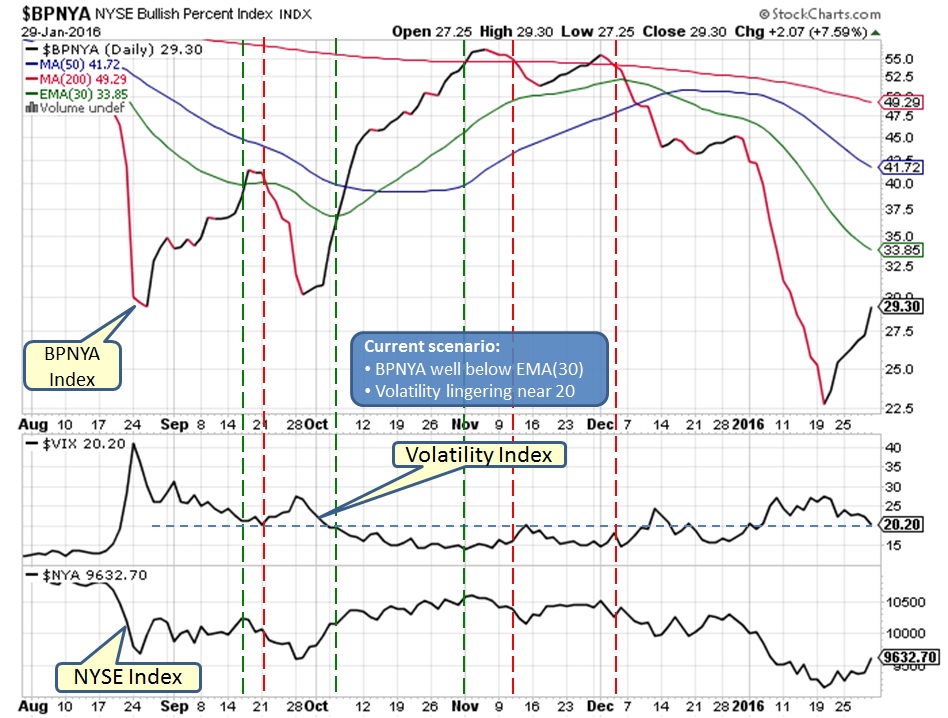 Bounce is clearly visible in NYSE daily chart below, watch out for numerous resistance areas overhead. 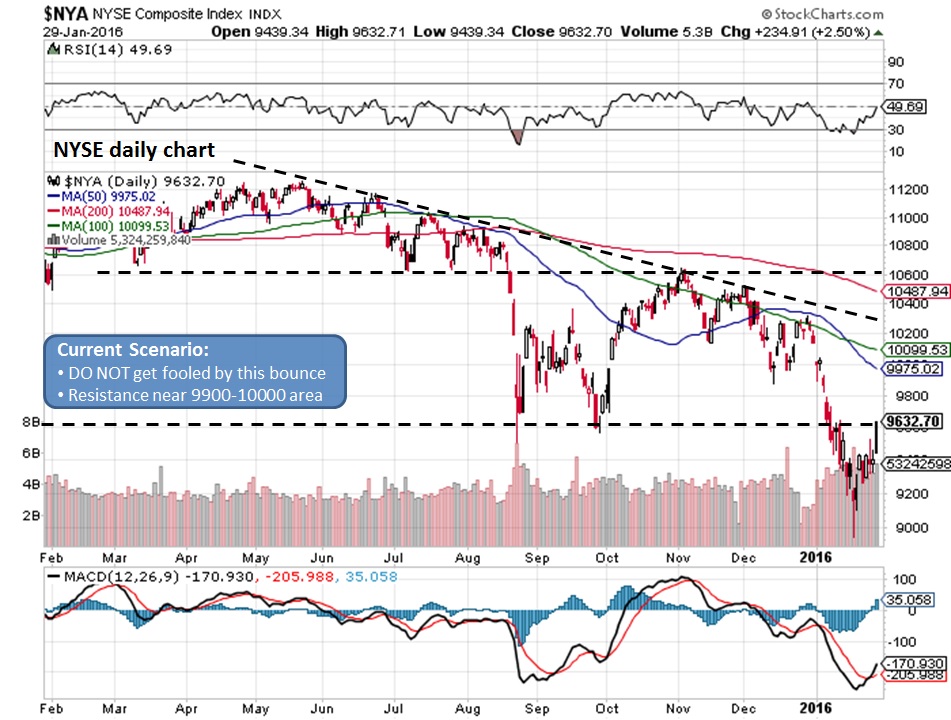 Weekly chart suggest that this is merely an oversold bounce and could reach up to 10,000 area. Once the bounce stalls than the potential drop further down is very likely. 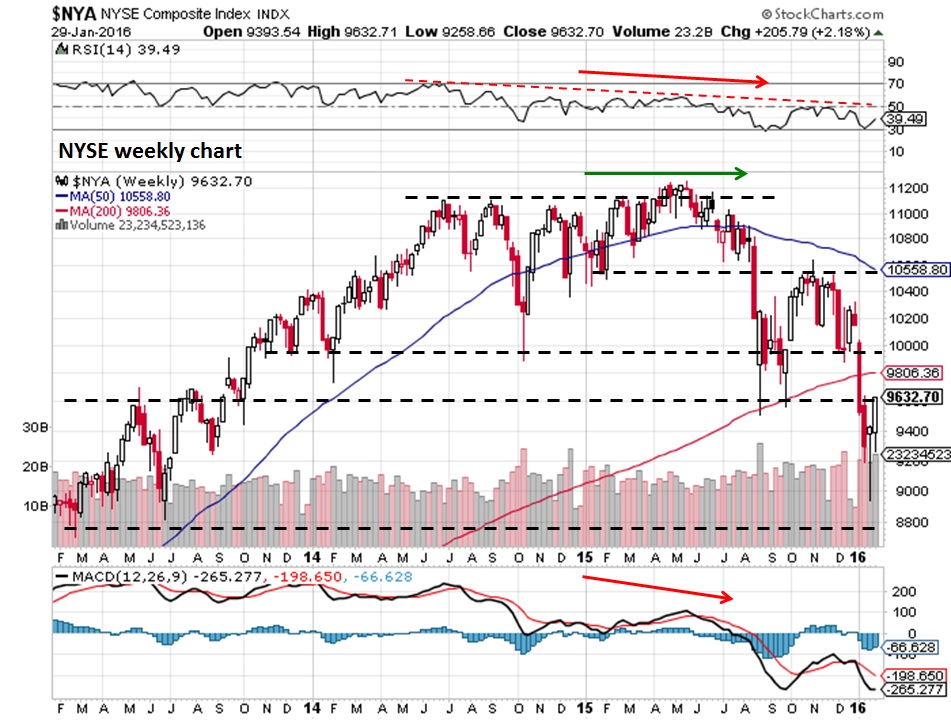 NYUD is in sync with weekly chart above and remains well below EMA(21). 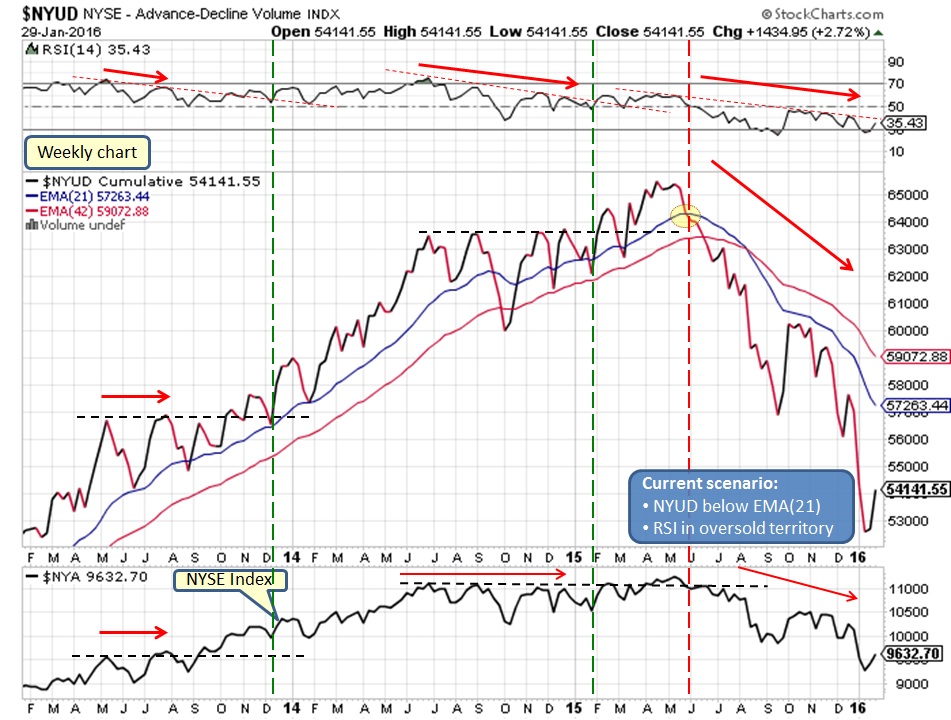 Below chart provides a key information that this market might be on verge of taking a plunge in coming weeks ahead. We are not expecting a 2008 type scenario but enough significant drop to spook everyone and drop the towel. Remember, this is precisely the opportunity one should be waiting for to take advantage when it happens. 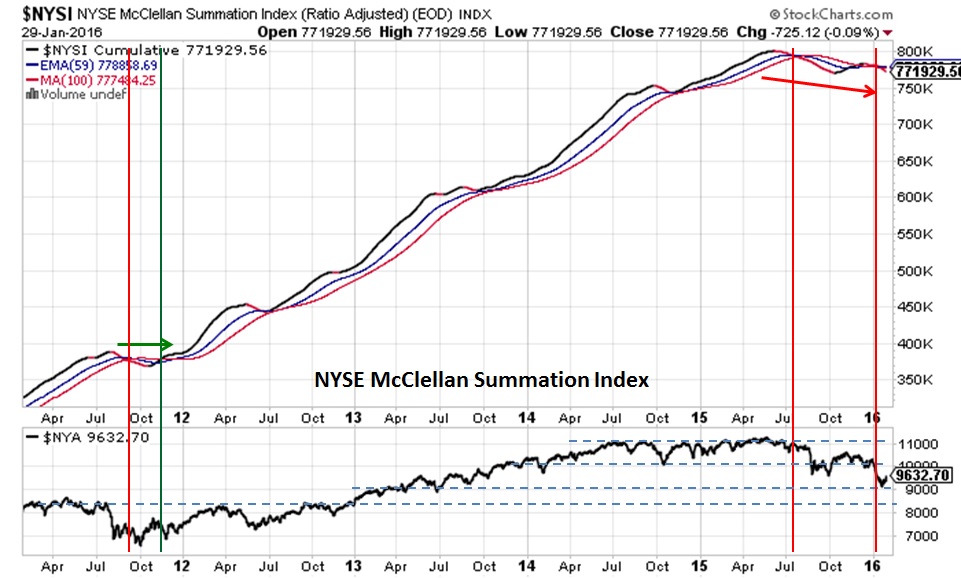 DO NOT get fooled by this bounce, and if you do decide to get in the market then make sure you have an exit plan. Once the bounce stalls (which could take several weeks or 2-3 months) by having a sideways move, further downside can be expected. However, a sudden drop cannot be ruled out.
What does it mean for our Investments?
Market remains in bear mode, stay way... Comments are closed.
|
What is NYUD?
What is BPNYA?Archives
January 2020
Categories
All
|
 RSS Feed
