|
Market continues to drop due to Euro-zone worries. How far will it drop!!! The real question should be, is this start of BEAR market or just a correction similar to what we saw last Aug-Oct 2011 period? Below BPNYA chart shows, BPNYA Index is not any where close to crossing EMA(30) line and could take some time for market to settle. Also the lower half of the chart shows, as volatility increases market tends to be choppy as well as drop further. 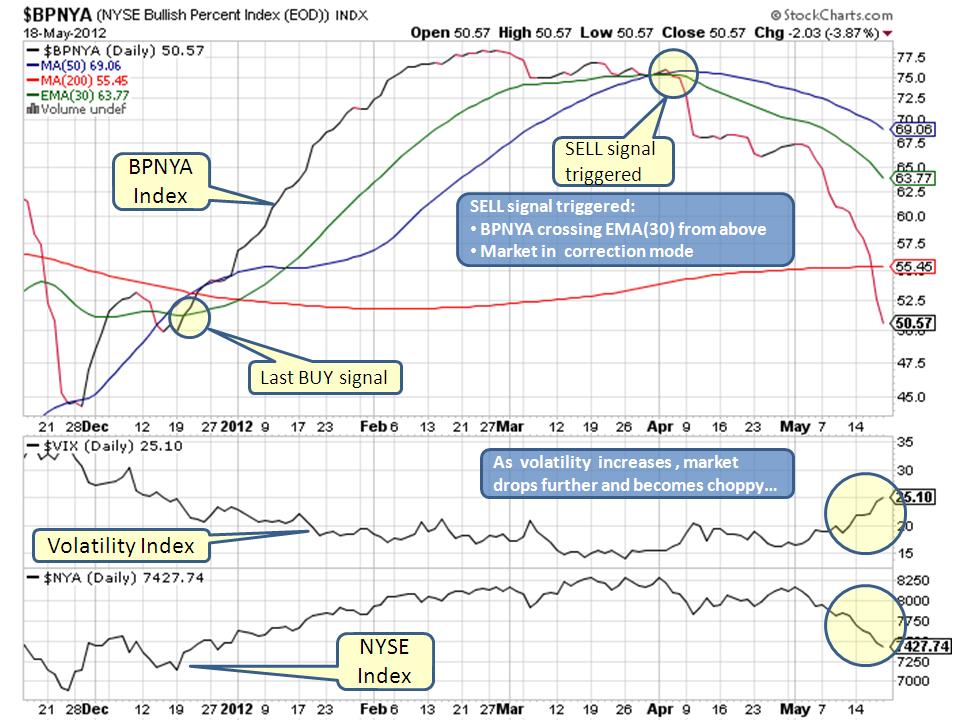
Below weekly NYSE chart shows a good observation. Every time MACD black line crosses red line (in bottom part of the chart), NYSE Index dropped significantly immediately or within 1-3 months. So what should we expect to happen in next 1-3 months??? Most likely, we might see a bounce effort followed by another round of selling. Now lets look at bigger picture, on below weekly chart. NYSE made high last year during April-May 2011, then a lower high in July 2011 and another lower high this March 2012. All this suggest that we are forming a BEAR market channel and could see significant drop in market in future probably in a year period... 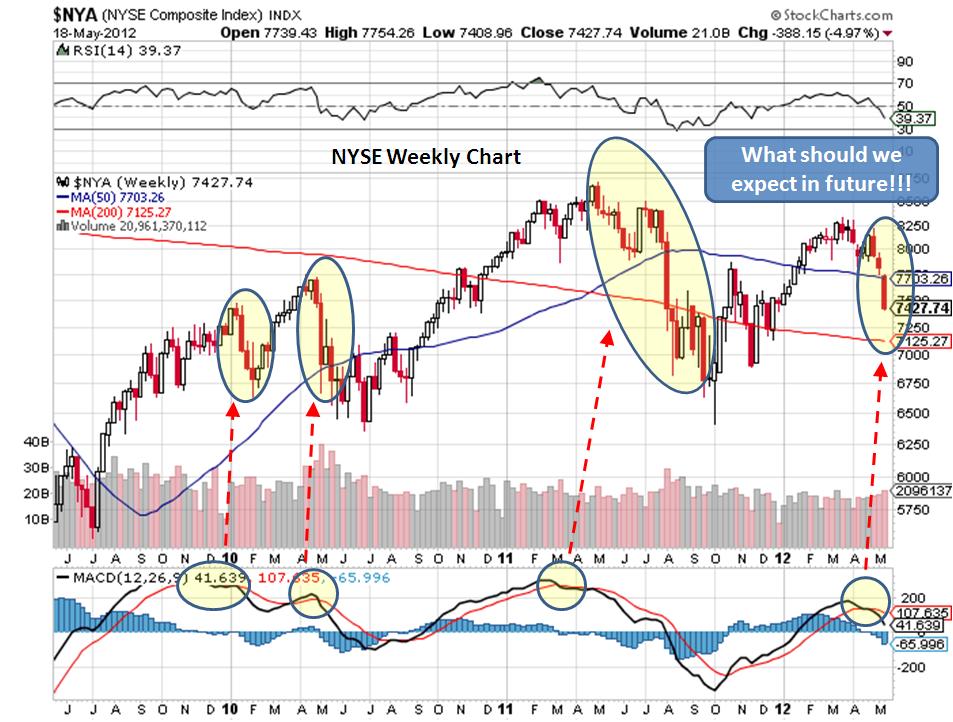
Well, its good to be cognizant about the future events but we HAVE to live in present and act accordingly. For now stay out of markets and if needs to be invested then use right investment vehicle as explained in our strategy section.
Stay alert and be cautious... Comments are closed.
|
What is NYUD?
What is BPNYA?Archives
January 2020
Categories
All
|
 RSS Feed
