|
Market has recovered from lows in Feb 2016, BUT are we clear for a rally? More risk of downside or missing the rally ahead? Let's see if we can infer anything from charts below... BPNYA appears to have breached 70 mark and on its way down! However, Volatility ($VIX) is at low levels but can turn at a moments notice. It's better to remain cautious in near term. 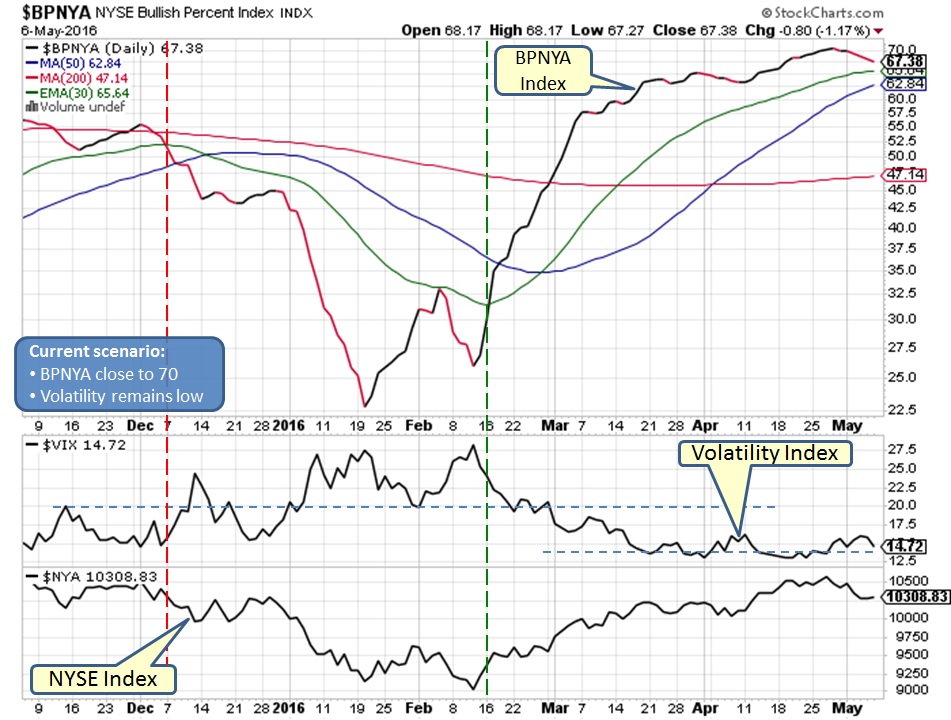 Daily NYSE chart provides subtle clues, as market is rising observe how PPO and MACD are not able to make new high rather they appear to be moving down suggesting a further drop in the market in coming days. Also RSI has dropped below 50 mark for now. However, market appears to be near support area hence a pause for few days or mini bounce before next drop can be expected. 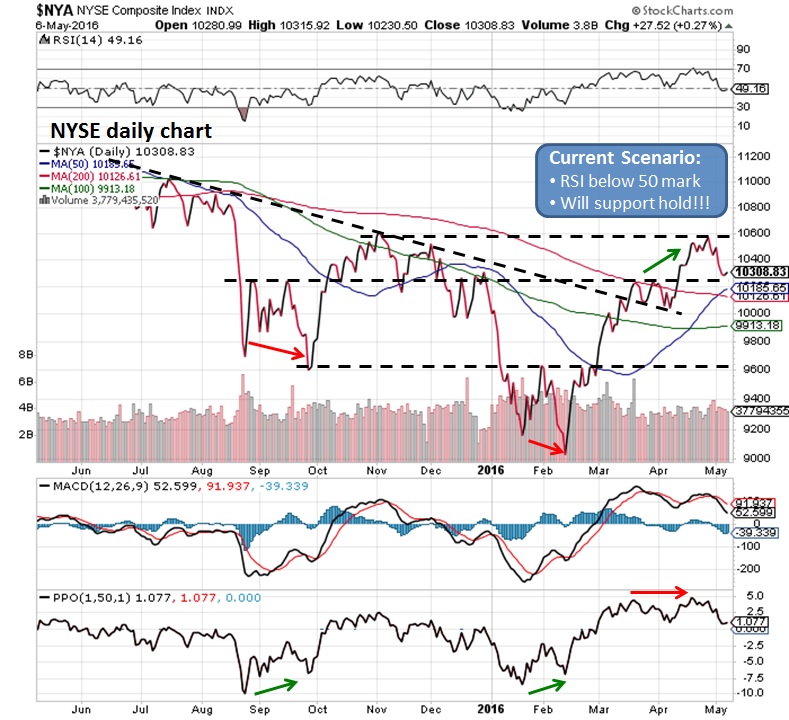 Weekly chart shows market hitting resistance near 10600 area and a possible drop to 10000 area cannot be ruled out. RSI needs to remain above 50 mark for a BULL rally. 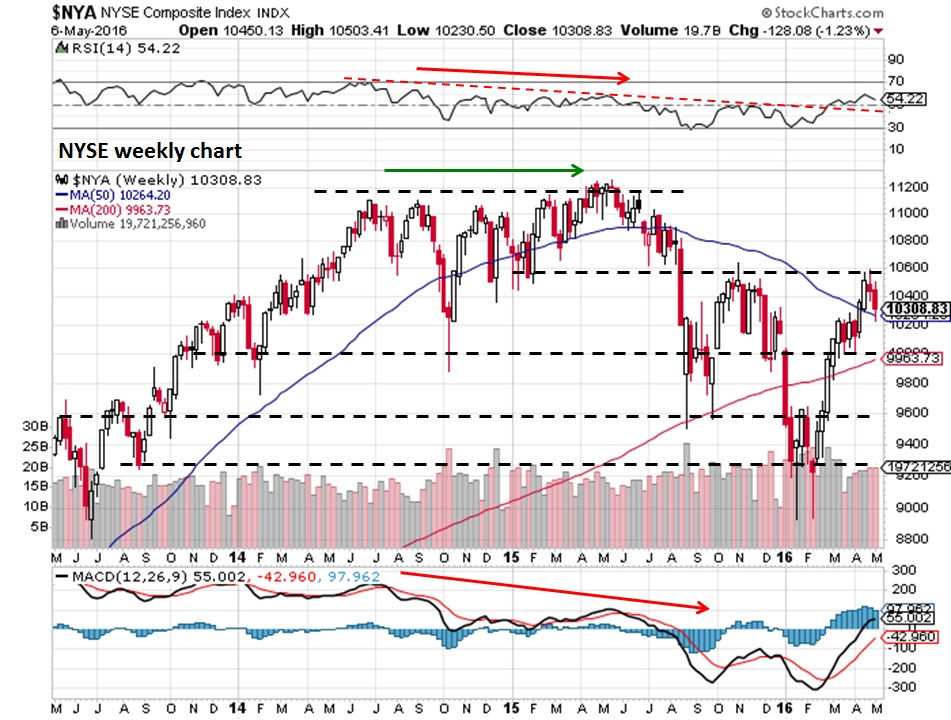 NYUD is suggesting that volume is supporting this market rally. 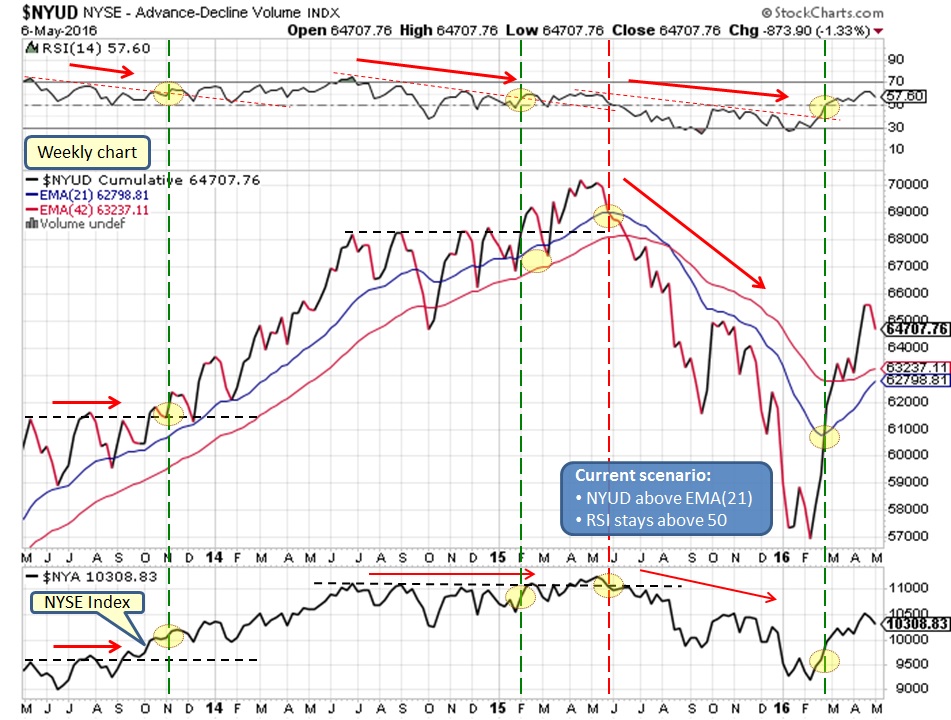 McClellan Index also suggest that more stocks are advancing than declining which is a good sign for the markets. 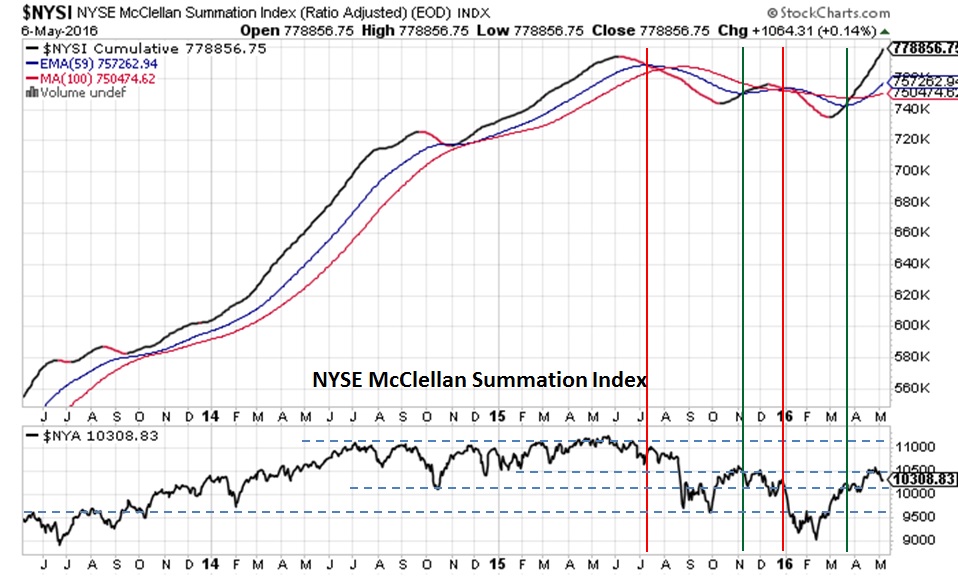 Overall the underlying breadth appears to be improving, however market can undergo another correction before any major bull rally gets underway. Time to be cautious and alert for now.
Market remains vulnerable, be cautious and alert... Comments are closed.
|
What is NYUD?
What is BPNYA?Archives
January 2020
Categories
All
|
 RSS Feed
