|
Market has been marching higher and higher for past four weeks but for how long will this continue? Is this the right time to enter the market? Is market bottom behind us and Bull rally ahead!!! Are charts providing any clues!!! BPNYA well above EMA(30) and Volatility ($VIX) have reached levels from where it usually turns around. It is highly likely that we will get more market volatility in coming weeks ahead. 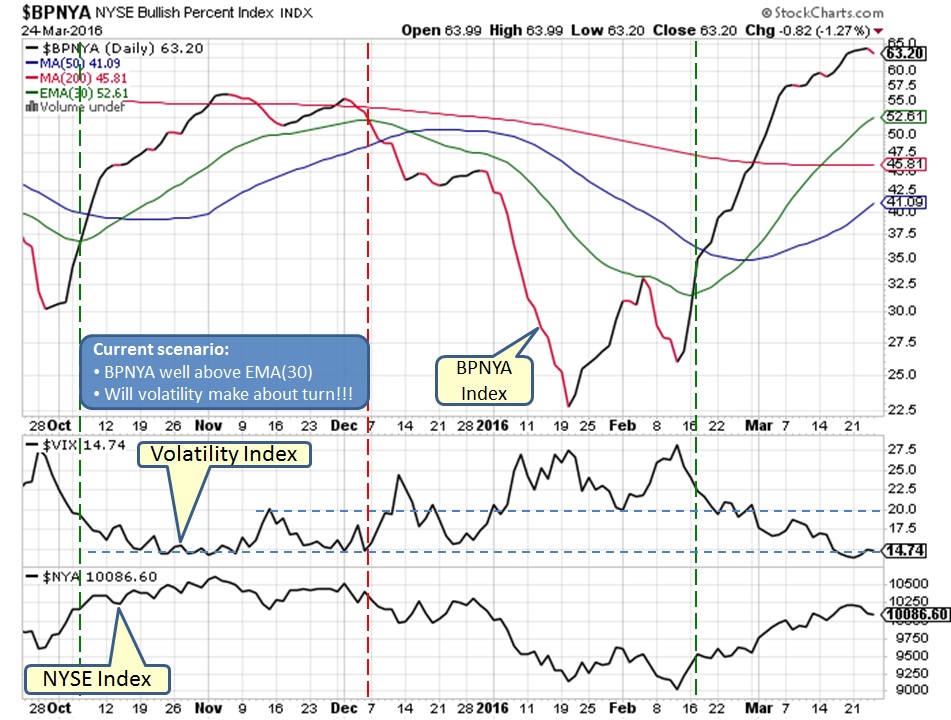 NYSE daily chart shows that market appears to have taken about turn as it hit MA(200) resistance. The magnitude of this reversal will define if market bottom is in or more pain to come. 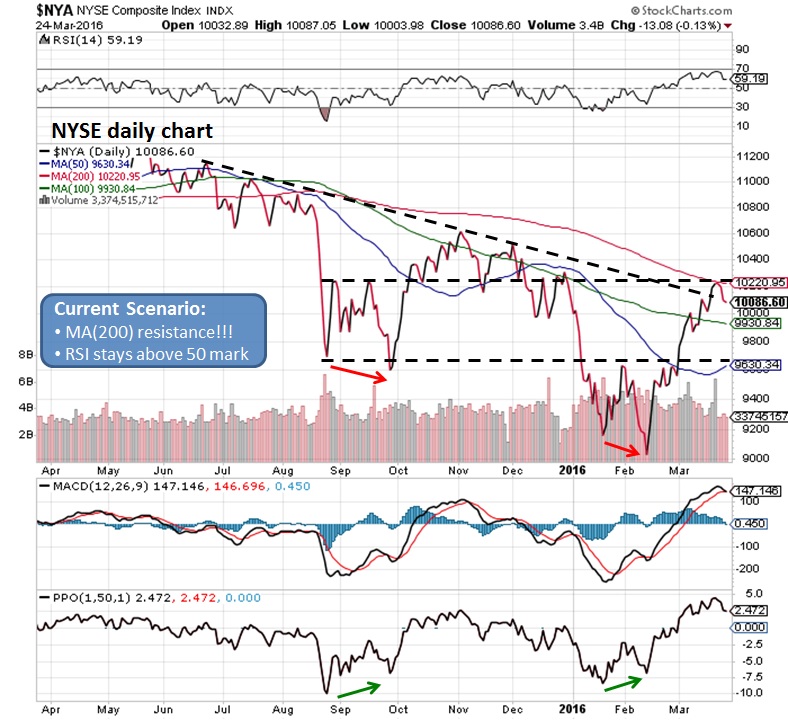 Weekly NYSE chart suggest that market might be bit tired after recent rally and needs a breather, RSI has managed to move above 50 mark and crossed dotted trend line. 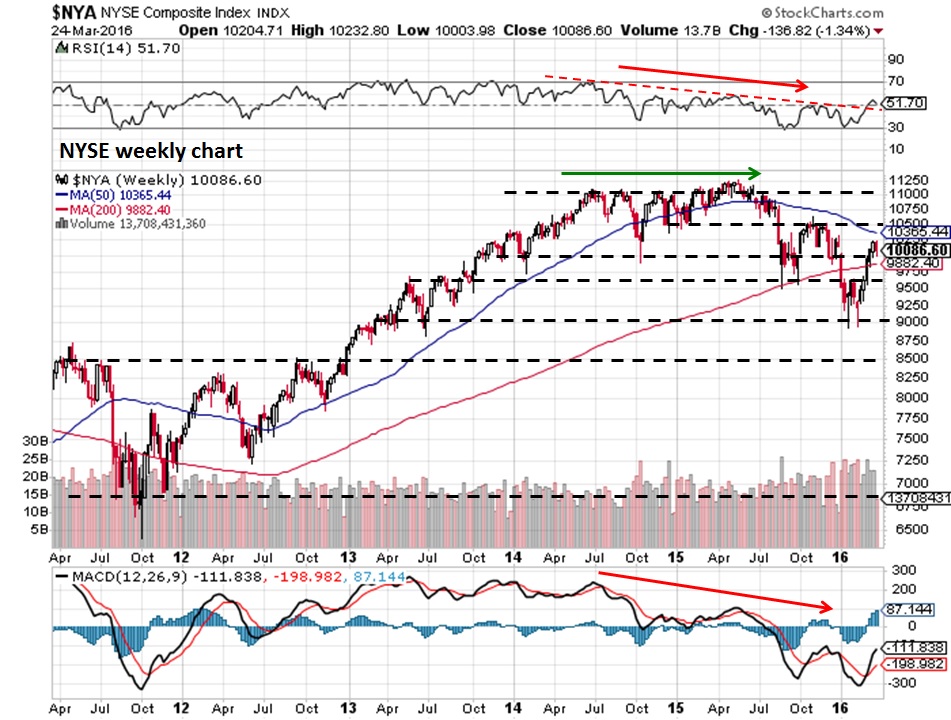 NYUD has succeeded in moving above EMA(21) as well as EMA(42) suggesting that recent market rally is supported by volume, also RSI has managed to move above 50 mark and crossed dotted trend line. 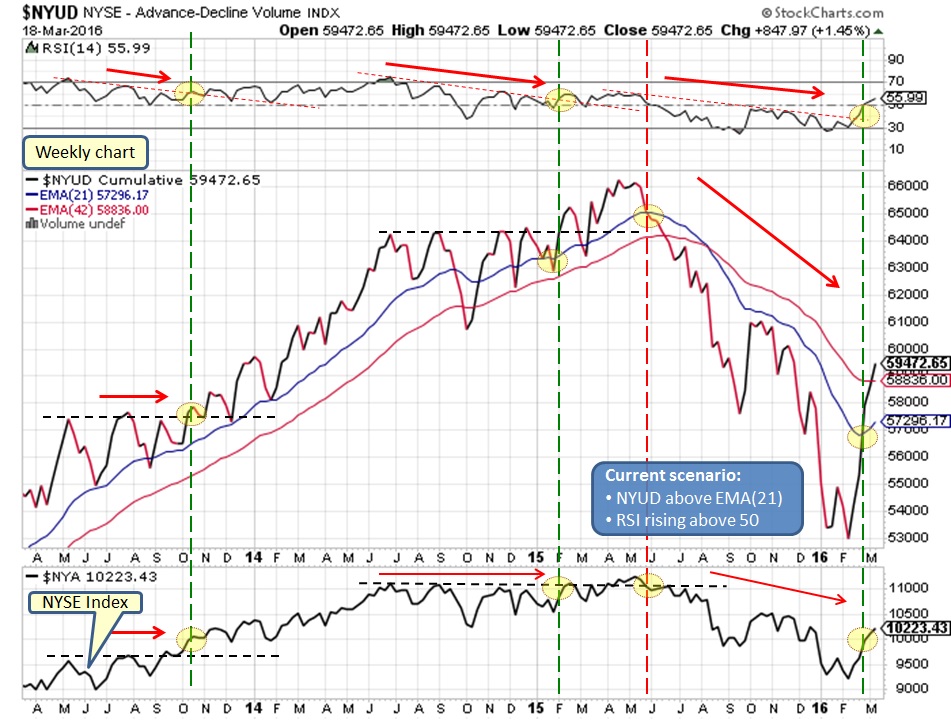 McClellan Index although trending down, does appear to be moving above EMA(59). 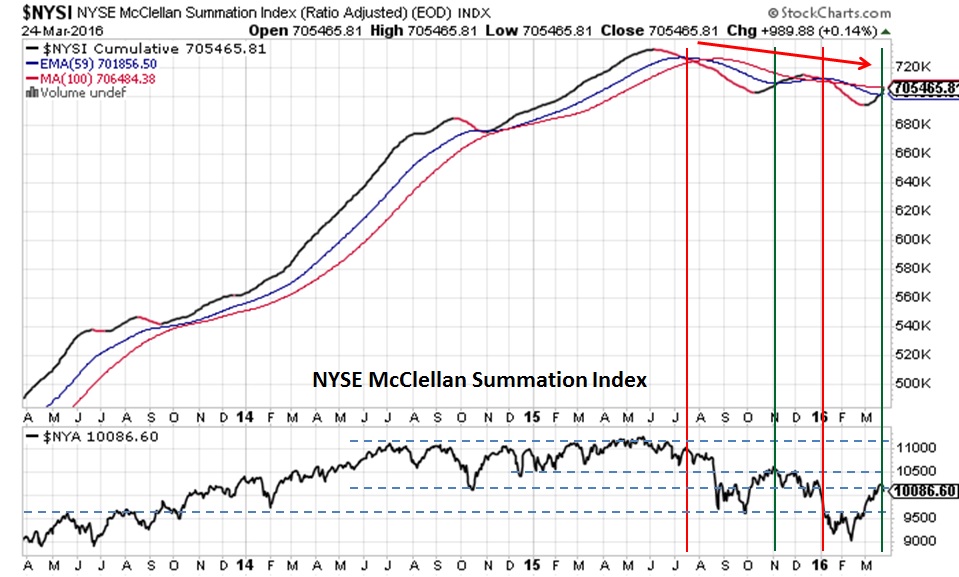 Overall, charts are telling us that market rally needs a breather and pullback or sideways action can be expected here. The magnitude of pullback will determine next market direction. Hence lets have patience wait for the pullback to get better low risk entry.
What does it mean for our Investments?
Market bounce appears strong but be careful... Comments are closed.
|
What is NYUD?
What is BPNYA?Archives
January 2020
Categories
All
|
 RSS Feed
