|
Much awaited Fed decision is out of the way and now market appears to be ready for its next move. BUT which direction and for how far? Will charts give us any clues? BPNYA finally above EMA(30), however do not get fooled. Volatility ($VIX) continues to remain above 20 mark suggesting to remain cautious. 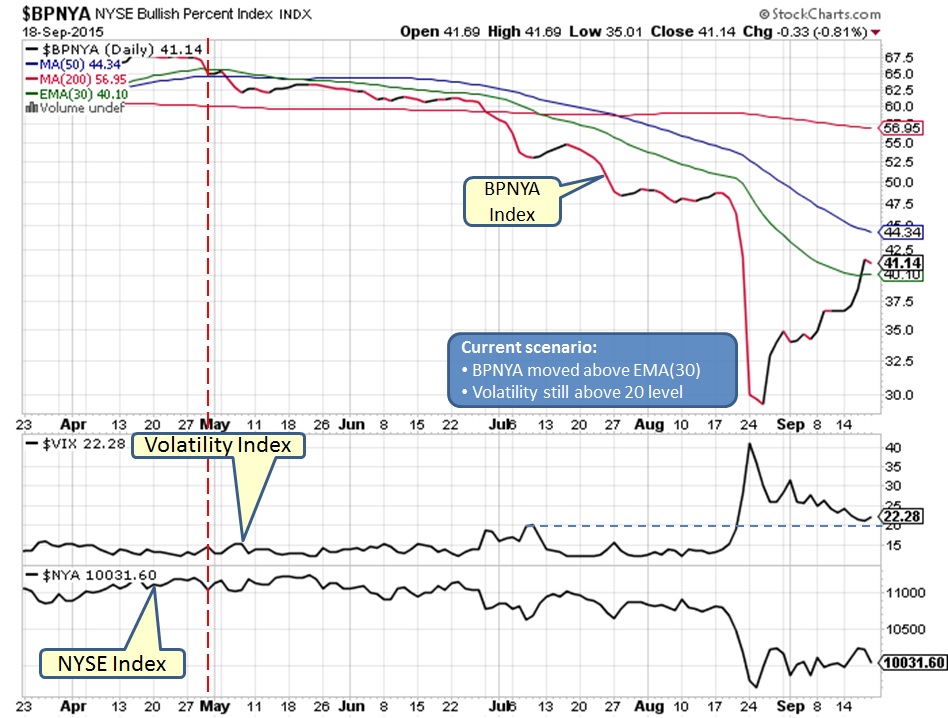 NYSE daily chart displays that current bounce attempt was capped at the resistance near 10300 area, RSI could not even get above 50 mark. Check out the volume on the last candle suggesting more downside ahead. 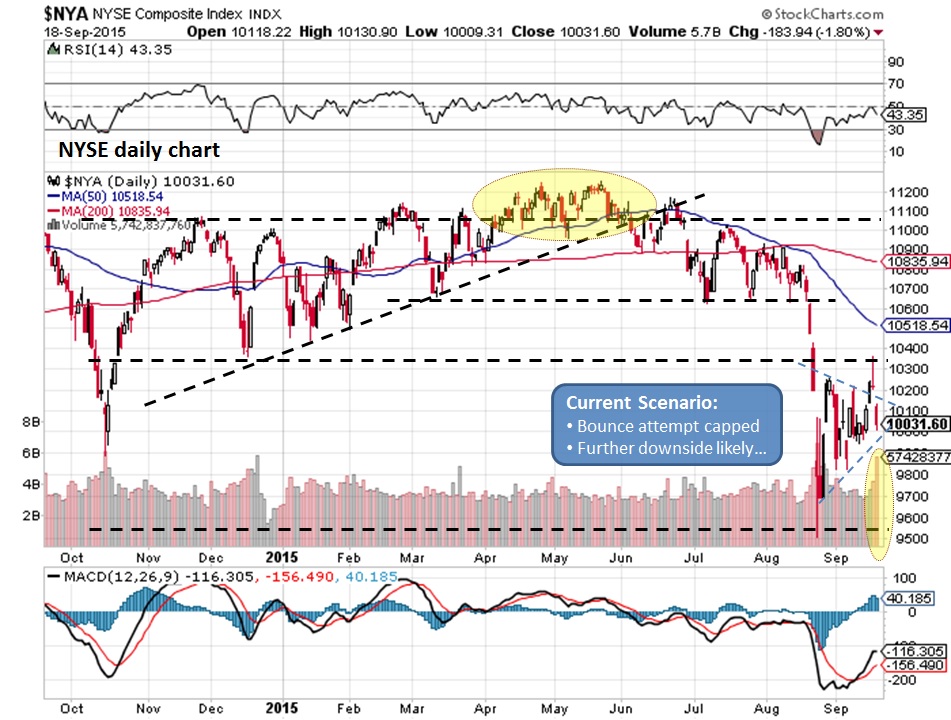 Weekly NYSE chart suggest that more downside might be ahead of us, BUT WHY? RSI not yet in oversold territory, however MACD is trending down. Also long top tail on the last candle suggest market might be headed to 9500 area before any meaningful bounce. 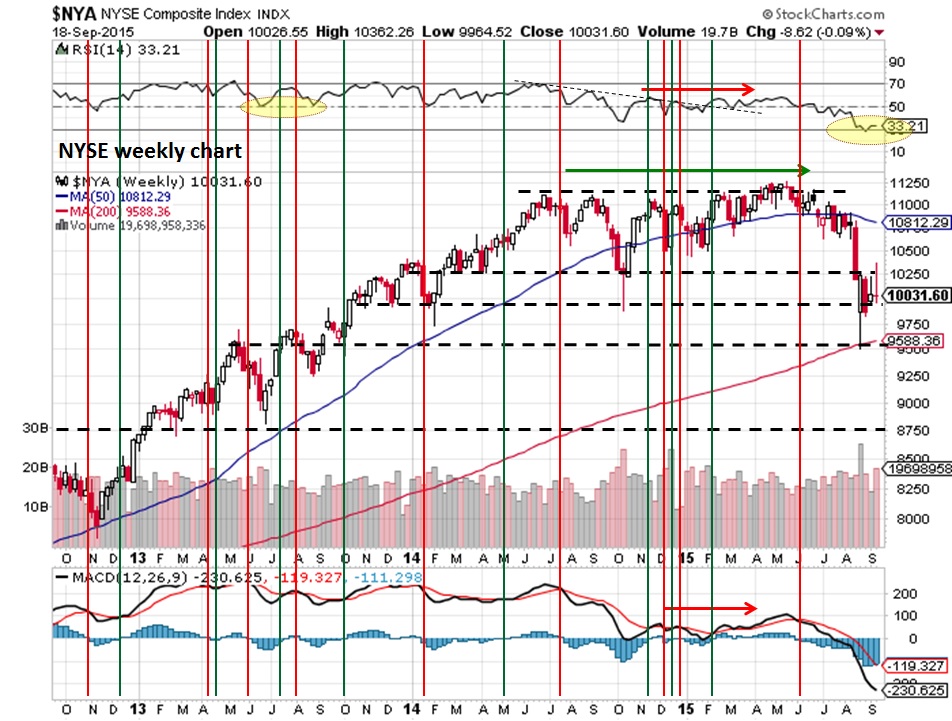 NYUD is way below EMA(21) & EMA(42) while RSI has entered oversold territory. 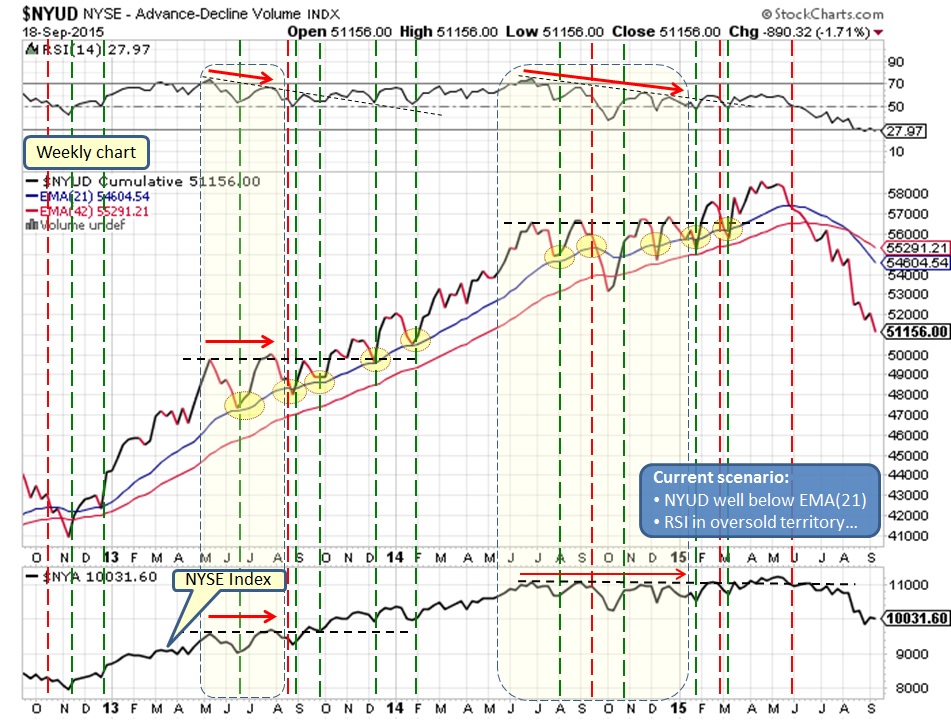 Charts are telling us that with Fed uncertainty out of the way, path of least resistance appears to be on downside.
market may continue to drift down and even break the lower low near 9500 area before turning around for another bounce attempt. On a bigger scale this looks like we are entering a bear market and once the meaning bounce attempt stalls, we shall get a more painful drop. Only time will reveal whats in store for us... What does it mean for our Investments?
Market remains bearish, stay on side lines... Comments are closed.
|
What is NYUD?
What is BPNYA?Archives
January 2020
Categories
All
|
 RSS Feed
