|
After making a W-bottom pattern, market has not yet broken out. Instead, market is entering resistance zone which will not be easy to break through. What are charts telling us? Can we find any clues? BPNYA is well above EMA(30) and Volatility ($VIX) appears to be subsiding below 20 mark both suggesting a possible bottom in the markets. 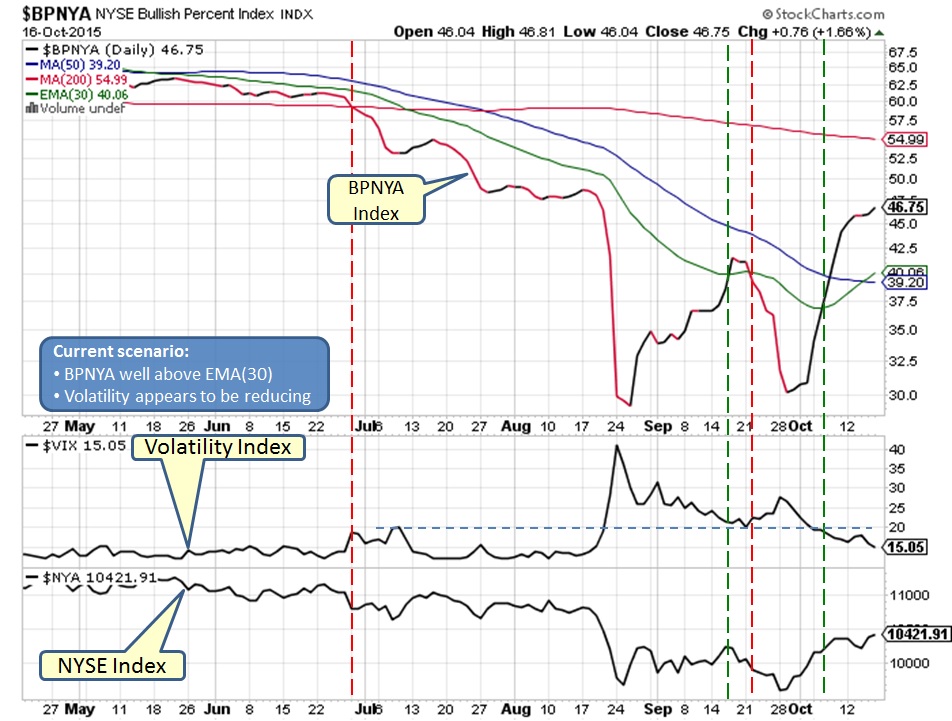 Below daily chart is displaying the resistance zone between 10400-10700 area along with MA(200) overhead resistance. Market will have to work through and show significant strength to overcome the resistance area. 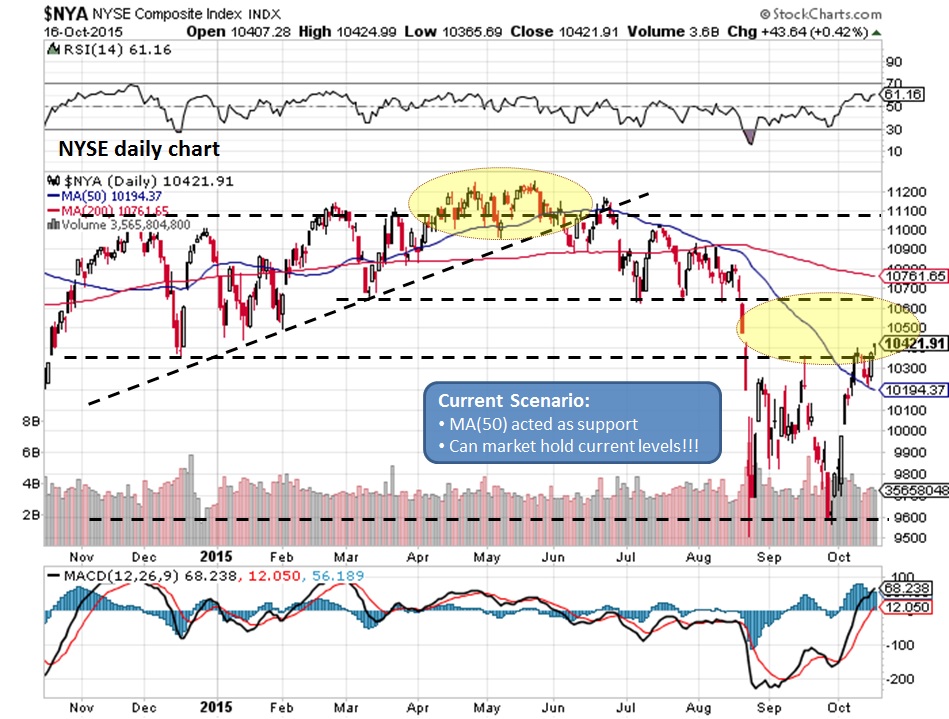 Weekly chart suggest that we are not out of the woods as RSI is below 50 mark and MACD crossover is yet to occur. 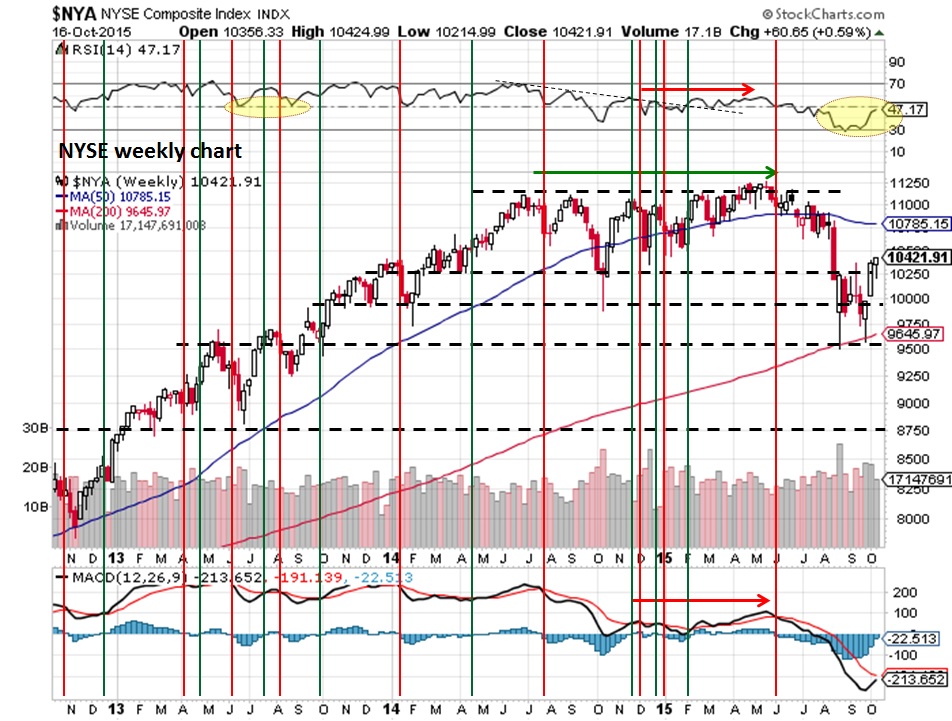 NYUD chart is also suggesting to be cautious as RSI is below 50 mark and NYUD has yet to cross EMA(21) line. 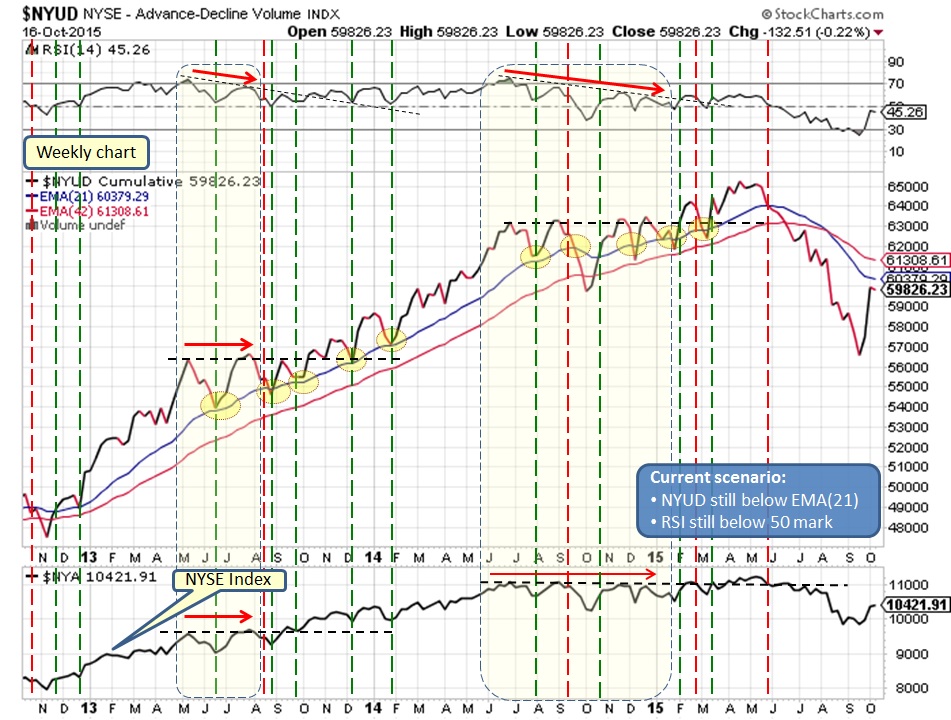 Charts are telling us that we might get a short term move on upside, we need to get significant thrust to break through the resistance levels which means we might be staying in a range for a while. Also earnings season is underway adding fuel to the mix, hence it will be wise to stay on the sidelines until we get an established trend.
What does it mean for our Investments?
Market trying to get back on track, be cautious... Comments are closed.
|
What is NYUD?
What is BPNYA?Archives
January 2020
Categories
All
|
 RSS Feed
