|
After making a NEW HIGH, market is taking a breather and might experience a pullback or sideways action for week or two. BUT will this rally continue after the pullback and how far will it really go!!! Where do we stand in long term picture!!! BPNYA continues to remain above 70 mark, while volatility continues to remain low for now. 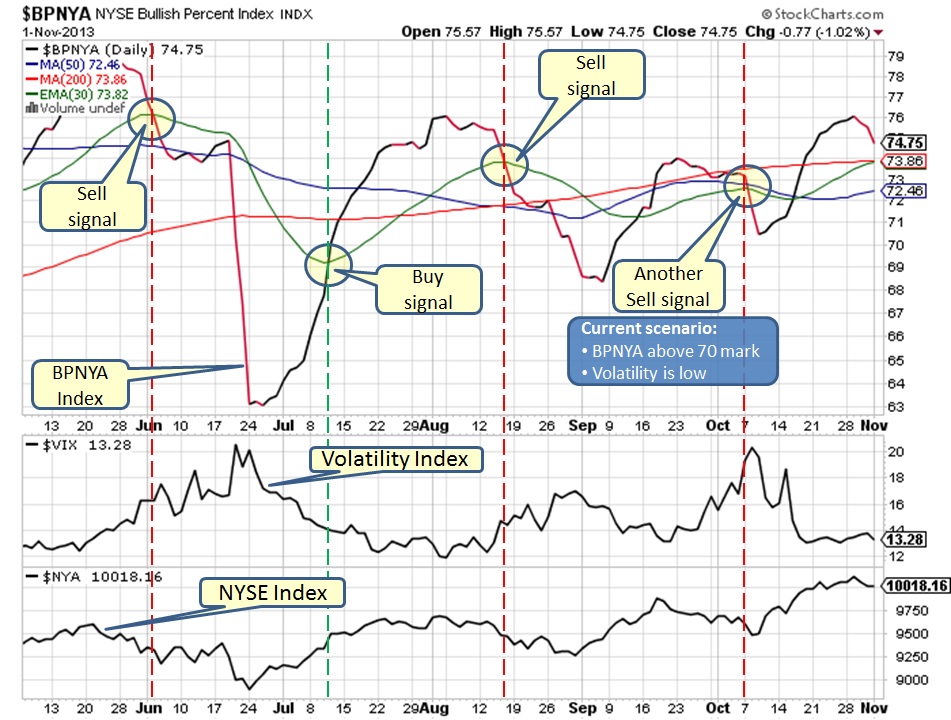
On daily NYSE chart, we can see that market has a support near 9900 level. 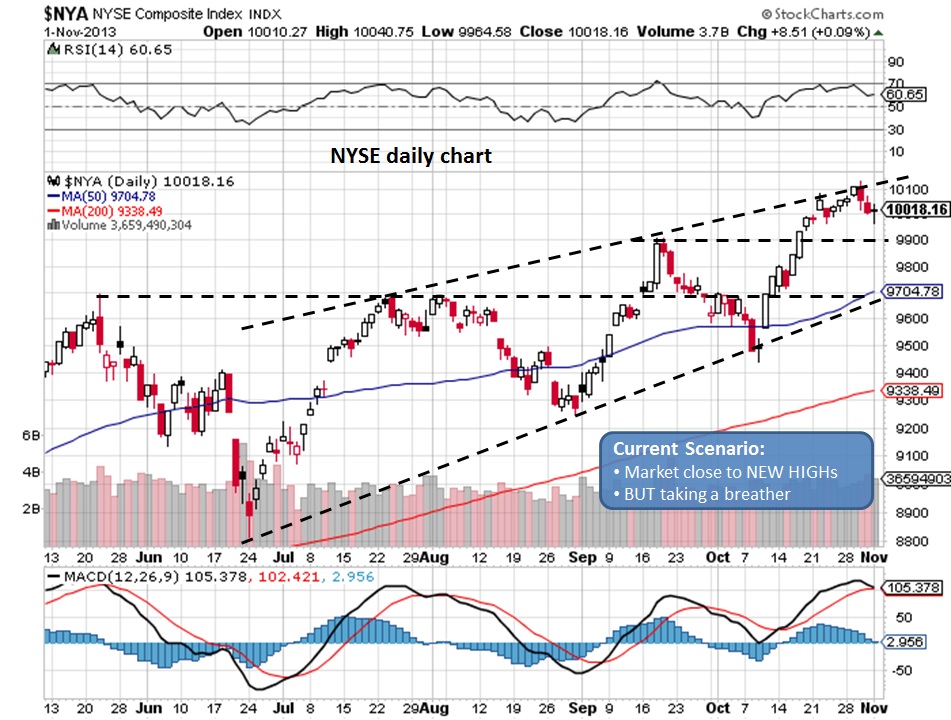
On weekly chart, divergence is still valid between Price & RSI, MACD. 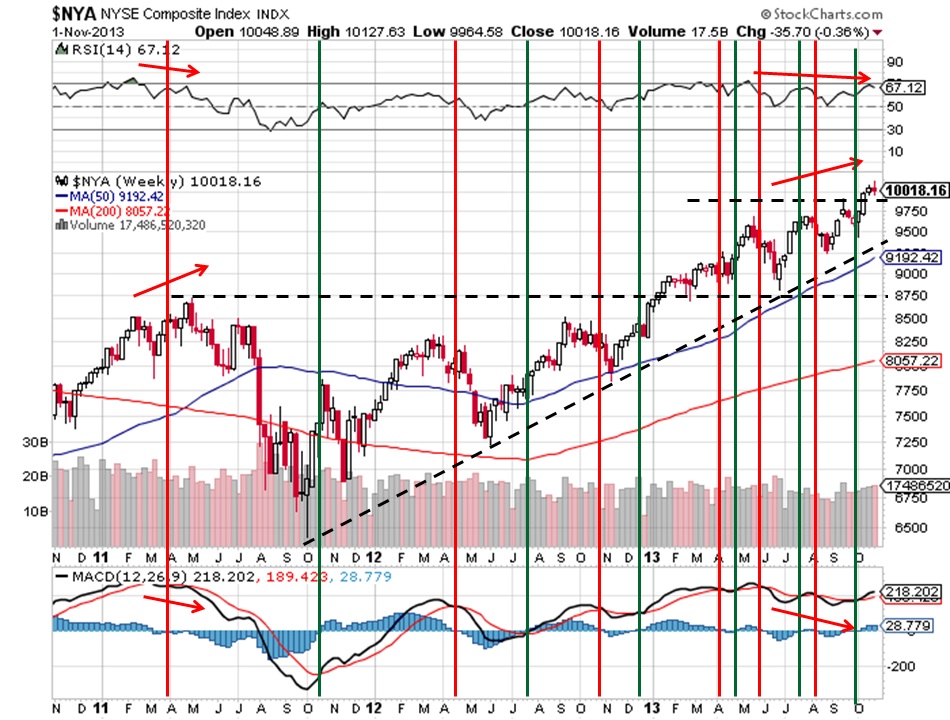
Based on above charts, longer term picture is not very clear. Market appears to pullback and then marches higher again, this is consistent from Jun-July 2013 on-wards. Hence it appears that every pullback is being bought by the investors. Now take a look at monthly Dow Industrial chart below. Make sure, you enlarge the chart so you can view 1999-2000, 2007-2008 & 2013 periods. Can we spot some similarities!!! Remember, below chart is a monthly chart but some indicators might show signs ahead of time where market is headed in next 6-8 months. What is your judgement? 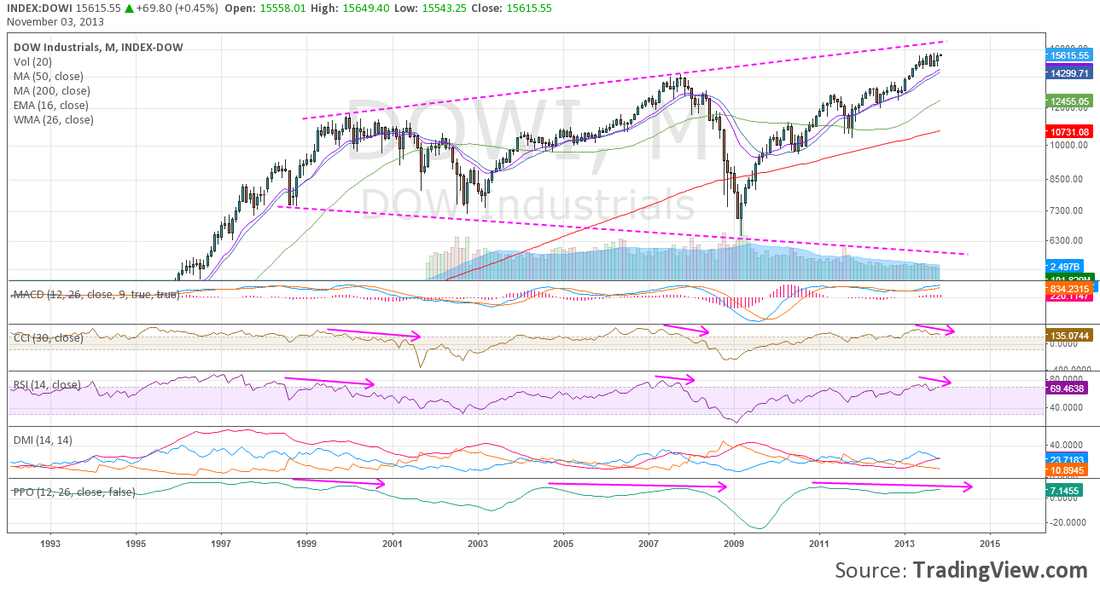
Based on all the information we have so far, it appears that market might make an attempt of final rally into year end. Sometime early next year we might see clear signs of where is this market headed. We are already seeing some early signs of things to come in next few months but confirmation will ONLY happen after the facts. Well this is just 1 side of the story.... we will cover another one in a future post...
What does it mean for our Investments?
Market continues to be bullish, however might experience a pullback... Comments are closed.
|
What is NYUD?
What is BPNYA?Archives
January 2020
Categories
All
|
 RSS Feed
