|
Market continues to rally without any signs of slowing down BUT can this rally continue any further as it is approaching resistance from earlier HIGHs. What are the charts telling us? BPNYA well above EMA(30) and trending higher. Volatility ($VIX) back at low levels which is providing fuel to this market rally. 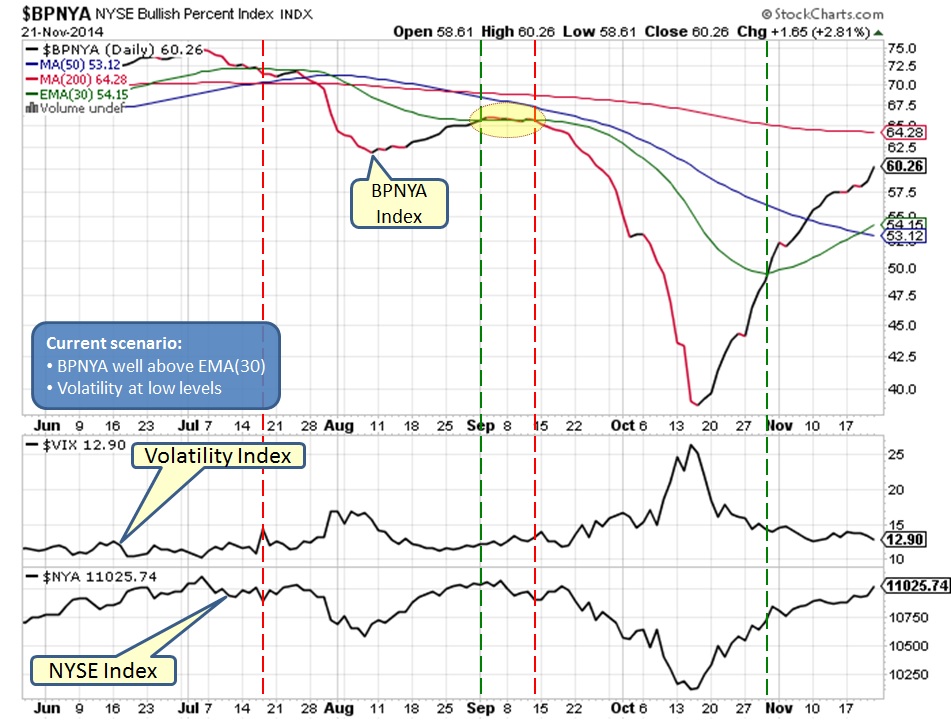
Market shall experience resistance near 11100 area as shown in below chart. 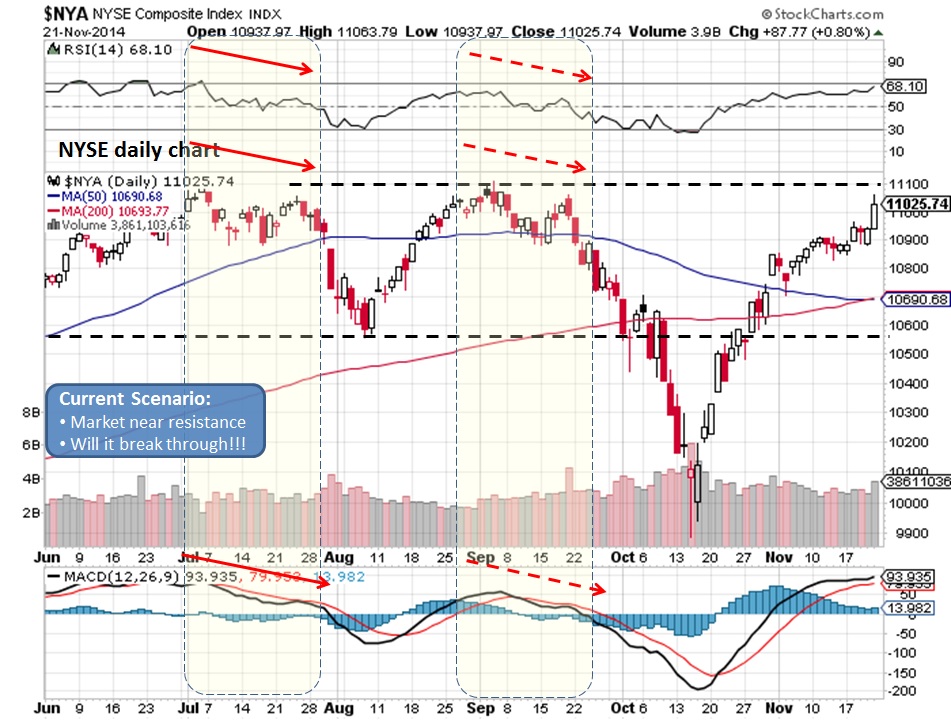
Weekly chart is showing that market is approaching earlier HIGHs which can act as resistance. RSI is above 50 mark, however the overall trend is down. MACD appears to be crossing over which would be good for this rally. 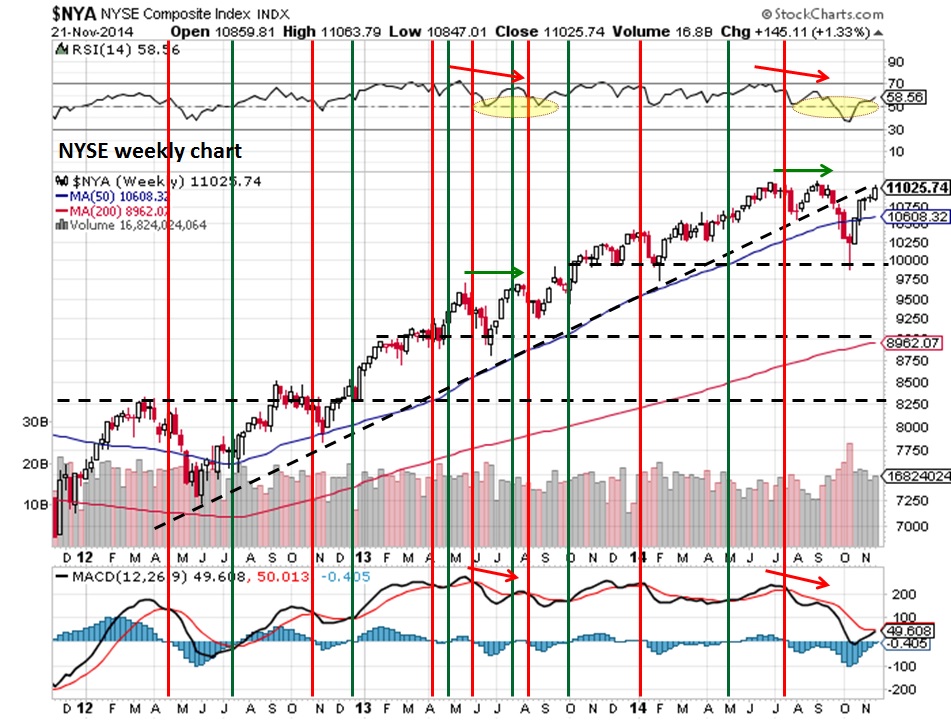
NYUD appears to be in a process of making NEW HIGH which would support the rally, however the divergence in RSI needs to be nullified as well. 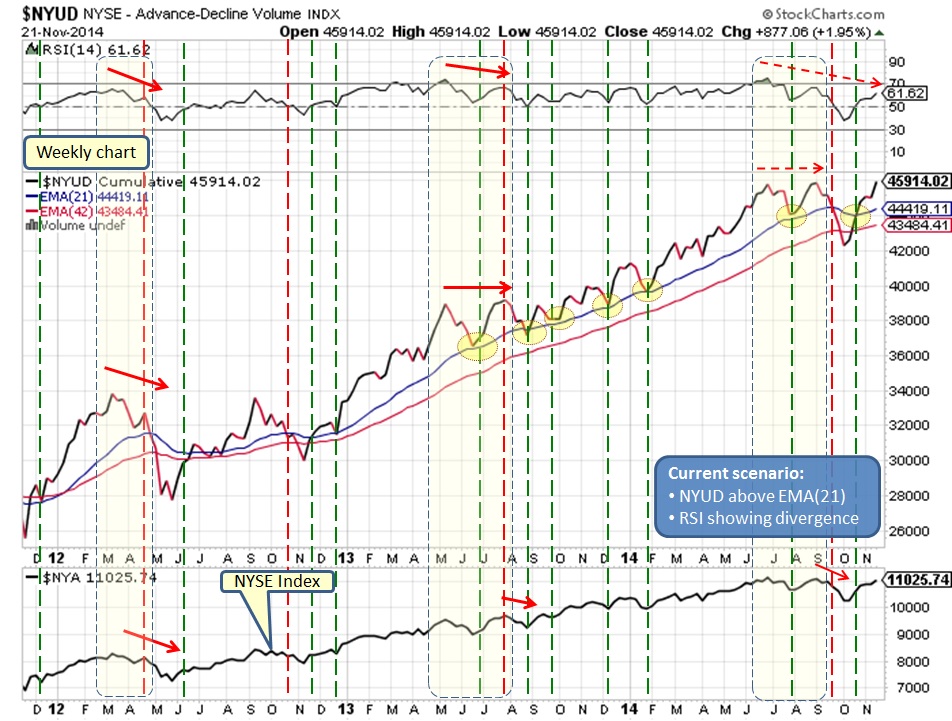
For now charts are telling us that this rally might have more room to run. Market might run into resistance from earlier HIGH at which point we shall know if this rally has enough strength to break through it.
What does it mean for our Investments?
Market in bullish trend, might experience resistance....
1 Comment
8/15/2016 01:26:37 am
BPNYA well above EMA(30) and trending higher. Volatility ($VIX) back at low levels which is providing fuel to this market rally. Leave a Reply. |
What is NYUD?
What is BPNYA?Archives
January 2020
Categories
All
|
 RSS Feed
