|
Market is in correction as of now without any doubt. Does it mean that the BULL trend which started earlier this year is coming to end!!! For now, this looks like a correction. The real question is how far this correction will continue? There is no way to identify how long market remains in correction mode but there are ways to know when it comes out of correction.... Below BPNYA chart tells the story so far, all we do not is have patience and wait for next BUY signal. It is clear by now that as volatility rises, market tends to become very choppy during correction. 
Below NYSE Index chart shows how 50 day moving average (black line) acted as resistance. As of now, market is trapped between MA(50) and MA(200). It can bounce around this two moving averages for weeks/months. 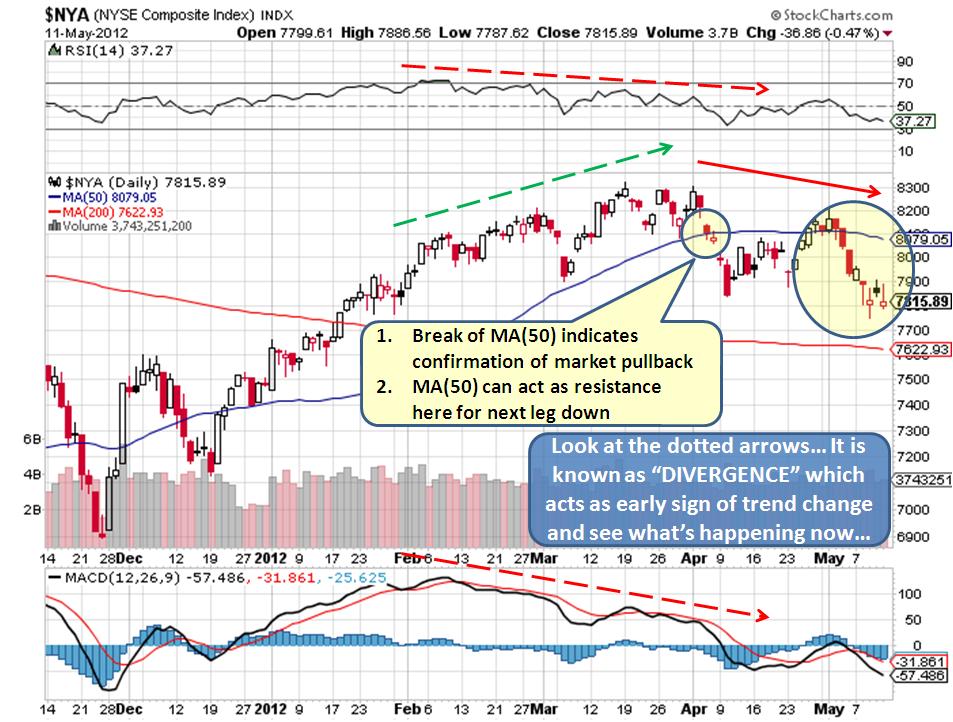
Since there is no way to predict when this correction will be over or how deep the correction might go along, the best thing to do is stay out of market and wait for BUY signal. It is lot difficult to have patience during market correction as market tends to be very volatile but having a plan pays off BIG time.
Remember, timing is critical to success... Comments are closed.
|
What is NYUD?
What is BPNYA?Archives
January 2020
Categories
All
|
 RSS Feed
