|
Past couple of days, Market is literally on a roller coaster ride. Last week, we got more details regarding, Fed meeting, ECB near term action & US jobs data which could provide much needed momentum and most likely we may see a sustained move UP. BUT how long will this move last? Not much changed in below BPNYA chart from last week. BPNYA still manages to remain above EMA(30) and inching higher. Volatility remains low and helps market to move higher. 
It is clear from below NYSE daily chart that market is still near resistance and trying to break it. However, volume is low on this move UP which remains a concern. 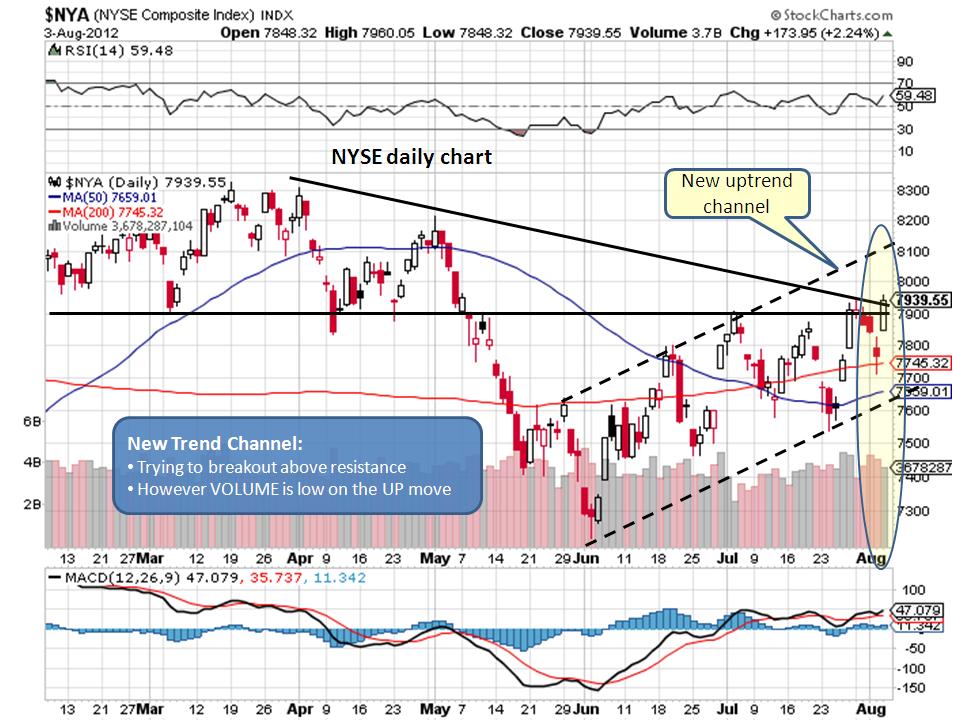
Interesting observation on weekly NYSE chart below: Is this UP move for real?
Now check the shaded rectangular area below. MACD gave a signal but RSI was barely moving above 50 indicating fake UP move, once RSI was above 50 decisively then the trend continued higher. 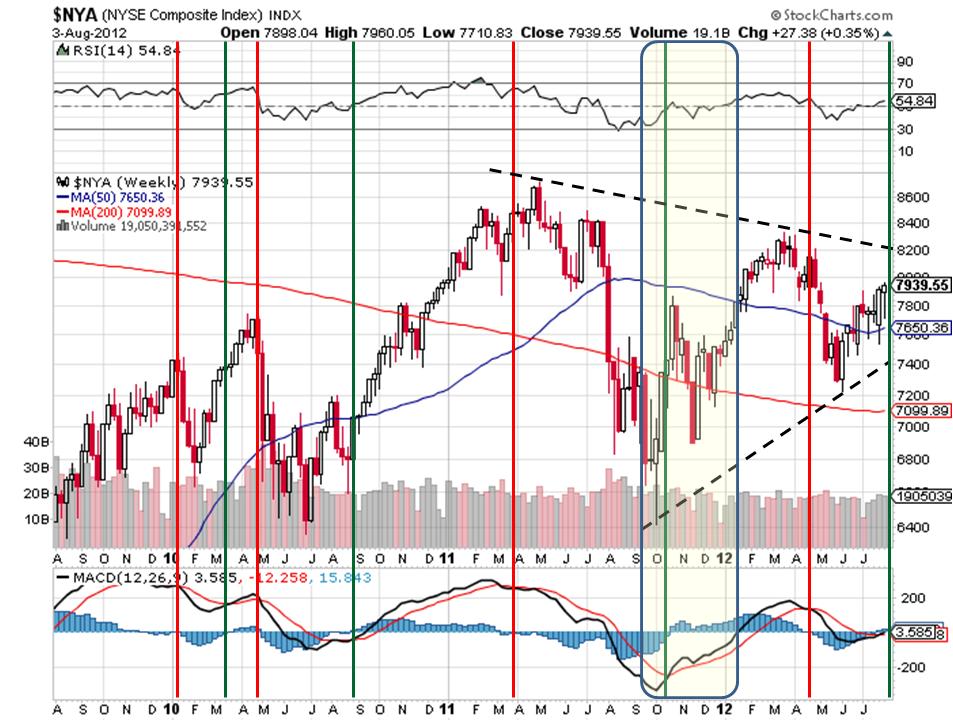
Expect next resistance to be at 9200 area, this means that the rally may continue for next couple of weeks before stalling. However, we should NOT forget that any negative news out of Euro-zone will disrupt this rally.
What should we do regarding Investments? 401K Investments - If you are already invested in funds then continue as NO SELL signal is generated. If you haven't yet invested then you may want to re-think. Stocks/ETFs - Invest is opportunities with good patterns but make sure you have STOP LIMIT to avoid major losses. Enjoy the party till it last... Comments are closed.
|
What is NYUD?
What is BPNYA?Archives
January 2020
Categories
All
|
 RSS Feed
