|
After a BIG move, market went into consolidation for past few days. This is considered a good sign for further bullish move. How far will this market fly!!! Below BPNYA chart displays that BPNYA is well above EMA(30), as volatility drops further market makes move higher. As long as volatility remains low, market can continue its marching higher at steady pace. 
Daily NYSE chart shows consolidation very clearly, BUT at the same time it is also evident that volume remains low which is a concern. Another push higher and market will be near resistance at 8200 area. However, market might pullback and find support at 7900 area. 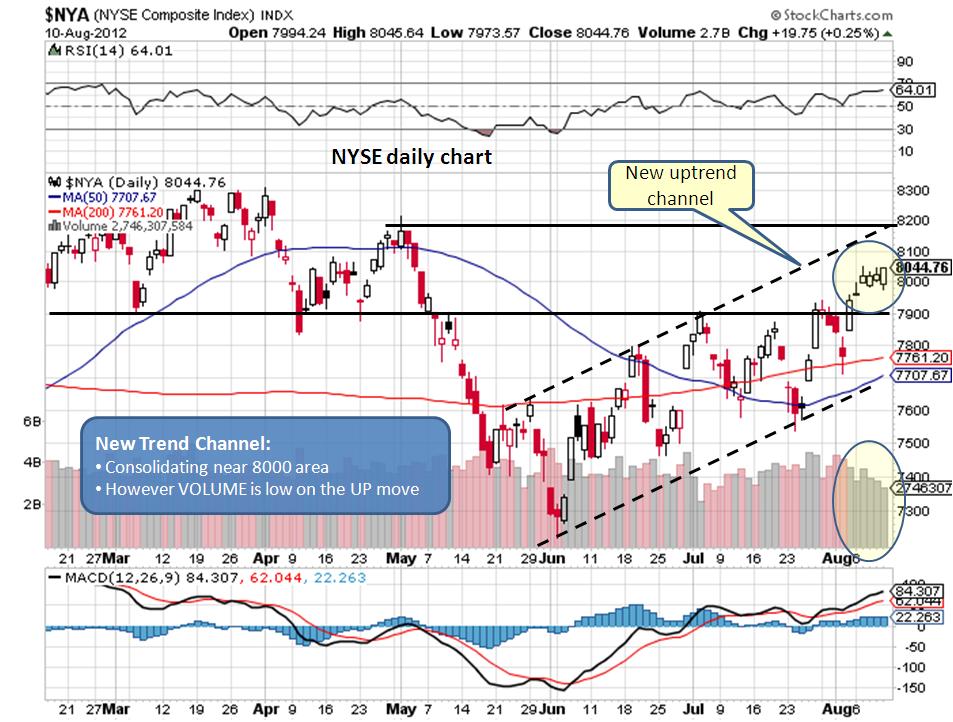
Weekly NYSE chart also displays resistance near 8200 area. For now, market remains bullish on weekly chart. Interesting observation on weekly NYSE chart below: All UP move has something in common -
Now check the shaded rectangular area below. MACD gave a signal but RSI was barely moving above 50 indicating fake UP move, once RSI was above 50 decisively then the trend continued higher. Now derive your own judgement for this UP move - 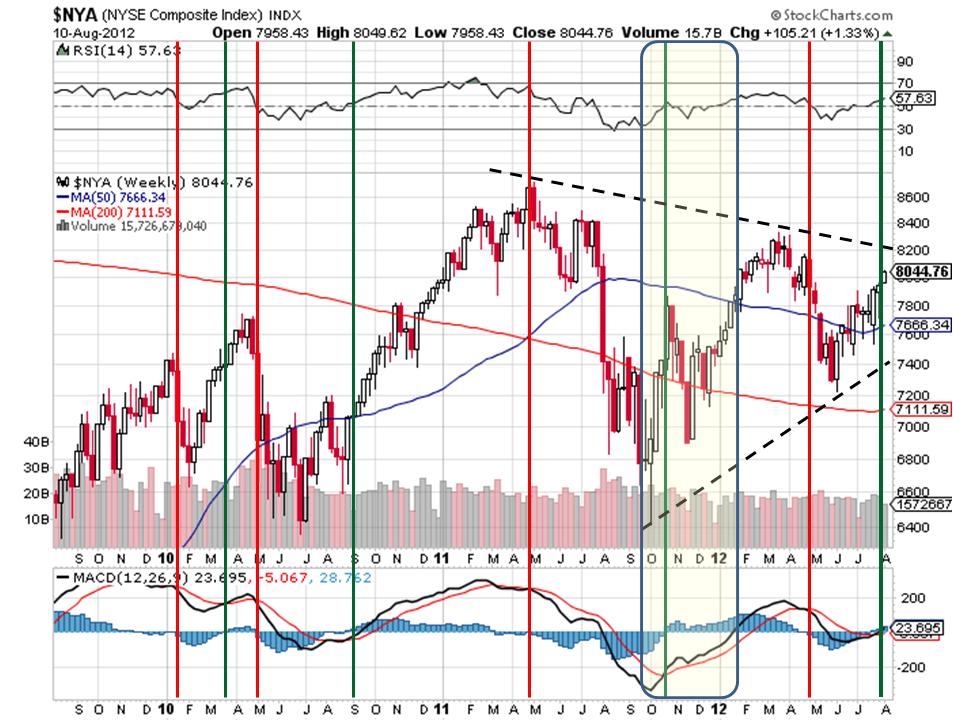
This rally may have some more legs before stalling, not to forget this is election year which tends to be bullish for markets.
What does it mean for our investments? 401K Investments: As of now, we should be invested in appropriate funds based on our Funds Ranking Sheet. Stocks/ETFs: Invest in right setups with appropriate STOP LOSS in place. Enjoy the party till it lasts... Comments are closed.
|
What is NYUD?
What is BPNYA?Archives
January 2020
Categories
All
|
 RSS Feed
