|
Market finally broke down after several months of range bound action along with a fake breakout. Is this start of a bear market or just another correction!!! What are charts telling us? BPNYA well below EMA(30) while Volatility ($VIX) has gone parabolic suggesting fear in the markets which has resulted in the sell off. 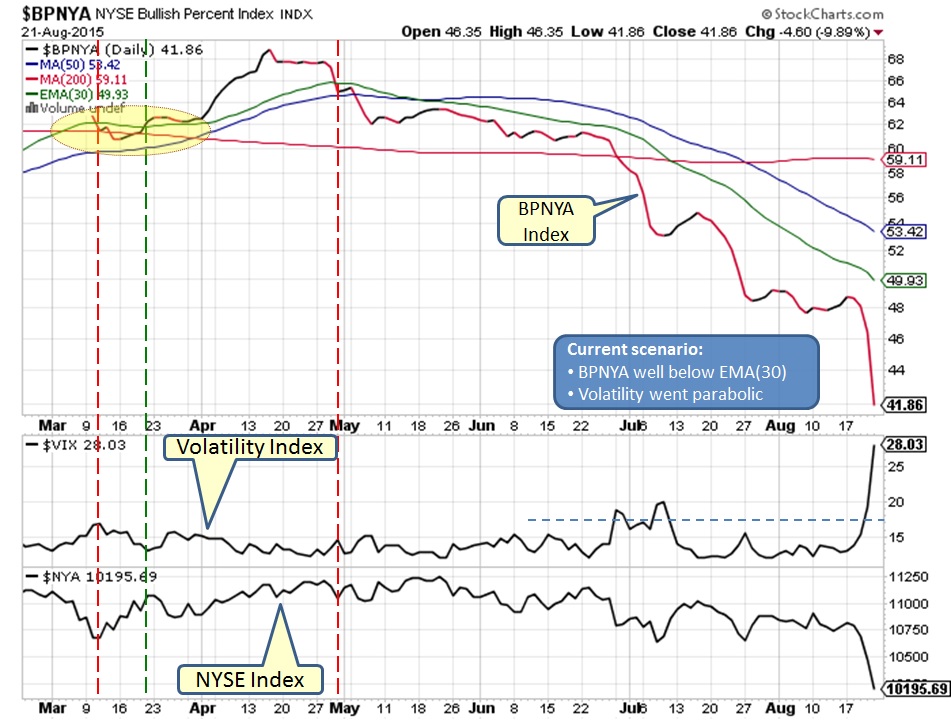 Daily NYSE chart clearly shows the break down below 10600 level on increased volume. Will 10000 area offer support for a possible bounce! 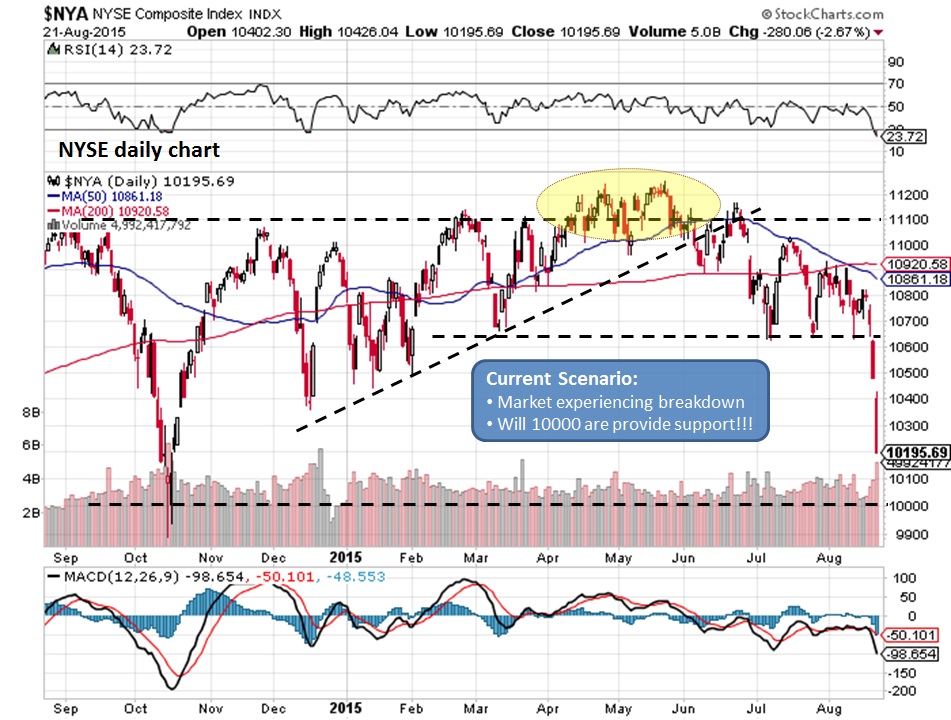 Weekly chart is suggesting a possible support between current level and 10000 area, also RSI is approaching oversold conditions. We might see a possible bounce once support is established. 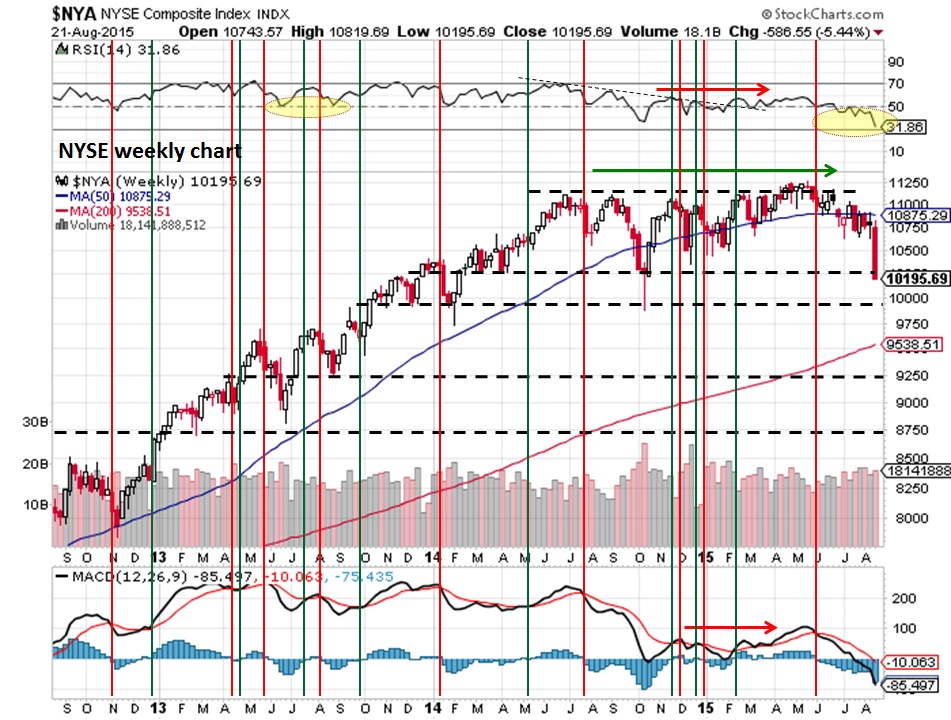 NYUD is way below EMA(42) while EMA(42) appears to be crossing EMA(21) which is NOT a good sign. This could be start of a bear market, however it is too early to tell. 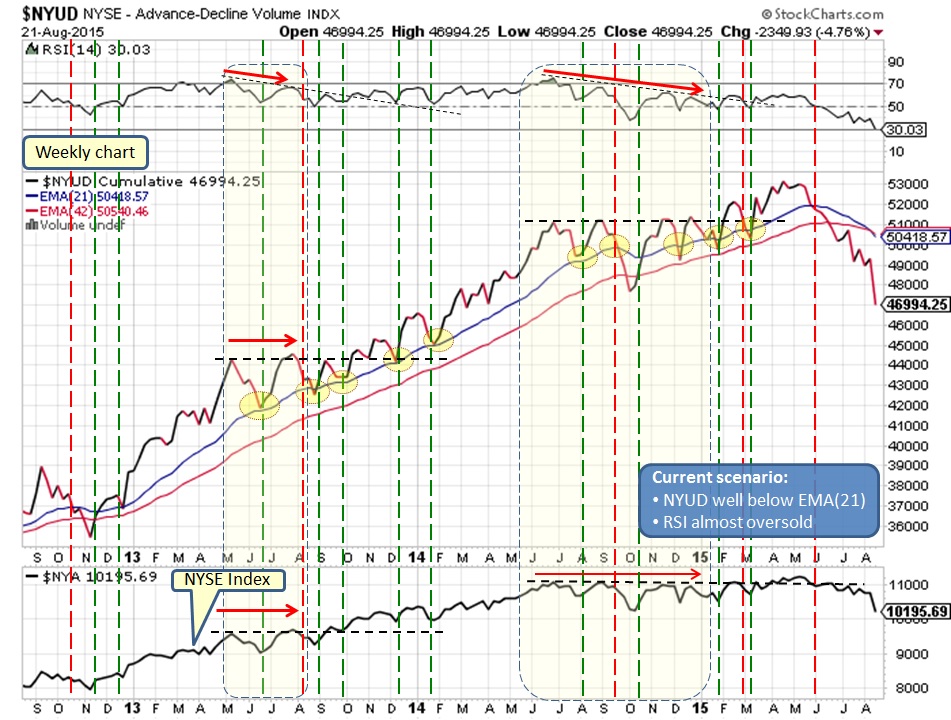 Charts are telling us that in near term we might see a bounce but maximum pain might be ahead of us. All this might take several weeks/months to cultivate but its better to have a foresight and be prepared.
What does it mean for our Investments?
Market enters breakdown mode, stay on sidelines... Comments are closed.
|
What is NYUD?
What is BPNYA?Archives
January 2020
Categories
All
|
 RSS Feed
