|
Market pullback of almost 5% in last two weeks was reversed hard in-spite of weak employment report which was discounted. Are these early warning signs of trend change!!! Where are we headed? After a long time, BPNYA has significantly dropped below 70 mark which suggests that we might get to a buying opportunity soon. Also volatility ($VIX) appears to be subsiding which will help the market to rise steadily. 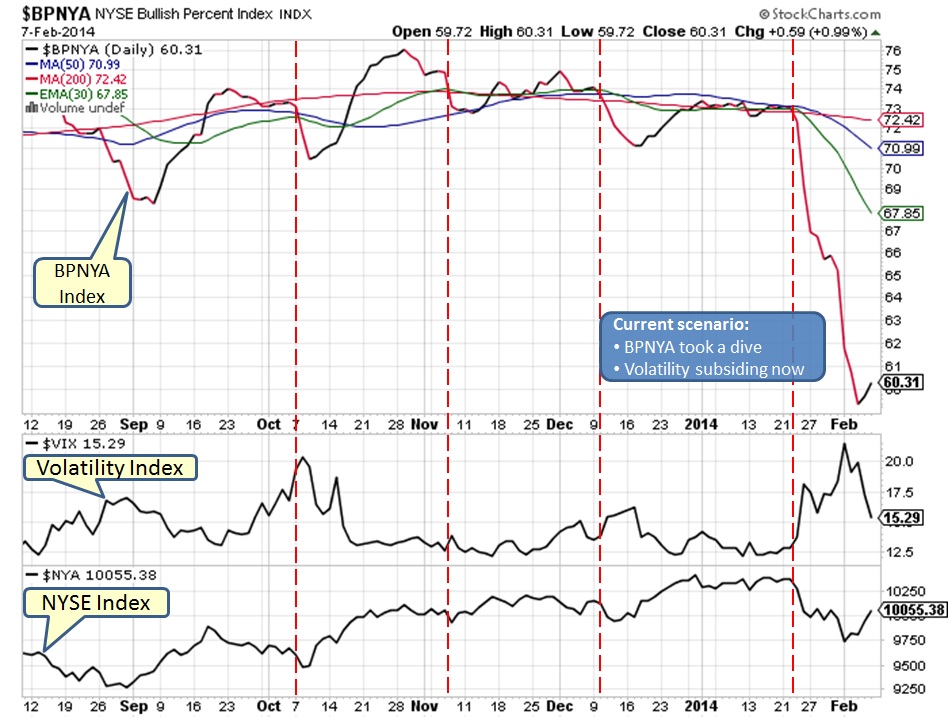
Daily chart below displays that NYSE bounced off from MA(200) line and heading towards MA(50) where it might experience some resistance. Market might be trapped between MA(50) and MA(200) for few days/weeks before making its next major move. 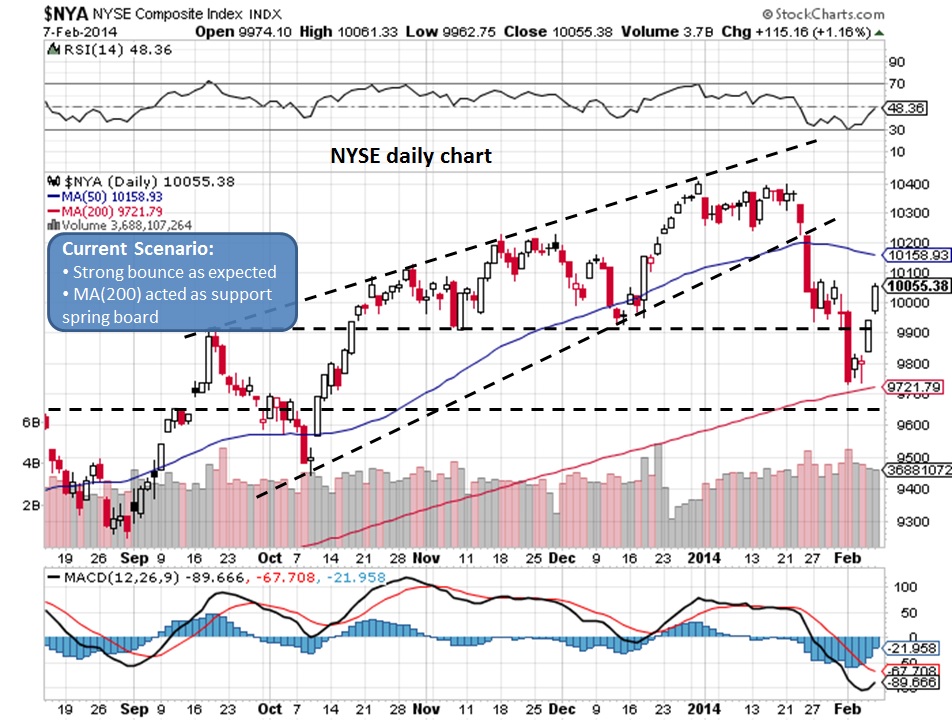
Weekly chart displays divergence between Price and MACD as well as RSI, however as long as market remains above dotted trend line we will have to give benefit of doubt towards further upside potential. 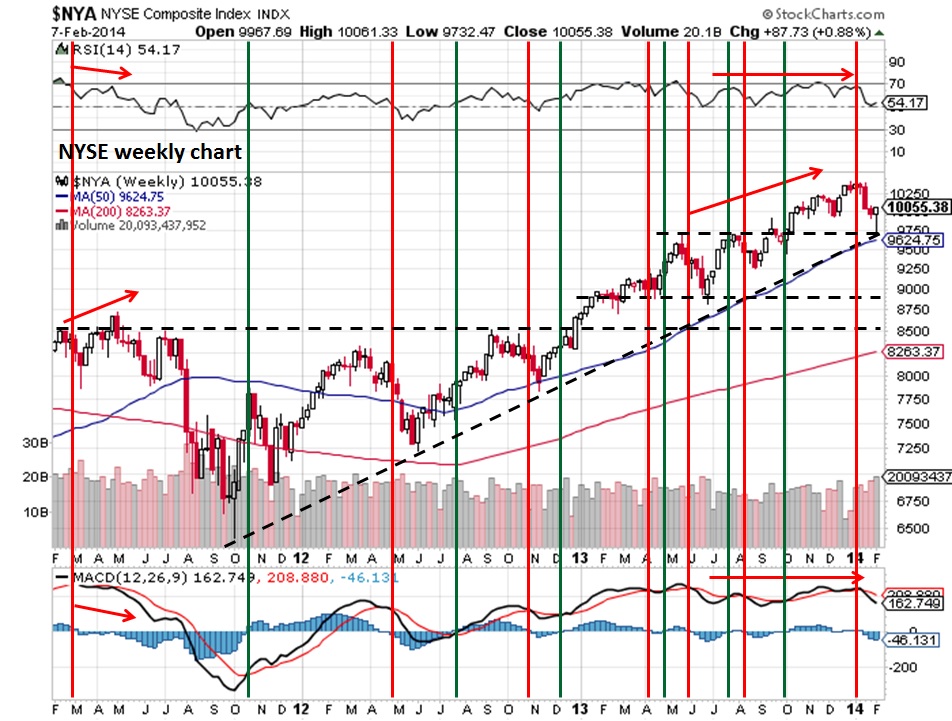
Look what we got in below NYUD chart. As expected, it bounced from EMA(21) line once again. Look at all the green dotted lines, every time NYUD crossed or bounced off EMA(21) it has been bullish for the market. Now take a look at red dotted line, NYUD makes a prior high peak and then fails to make a higher high peak next time which suggests a market decline in coming days. This is also shown by red arrows in three different cases. 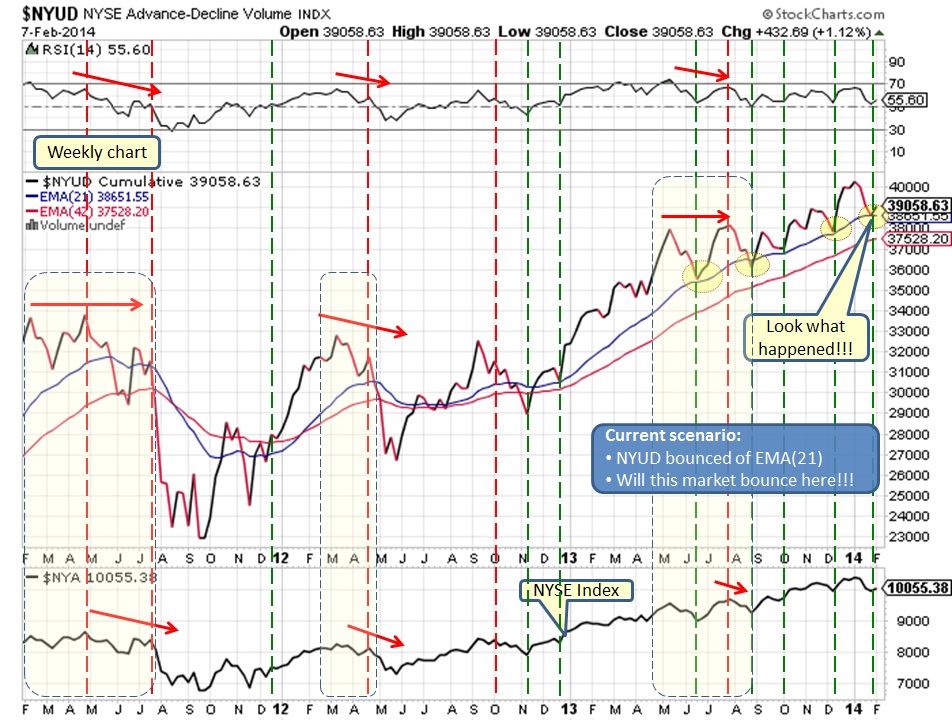
Most likely we shall see some sort of market consolidation in coming days/weeks as market might remain trapped between MA(50) and MA(200). Once the market starts a rally above MA(50) and NYUD (NOT NYSE) fails to make a new higher peak compared to earlier high peak then it would be time to be cautious as we might get a volatile pullback/correction. However, all of this action could take anywhere from 6 to 10 weeks as it evolves.
What does it mean for our Investments?
Pullback appears to be over but wait for confirmation... Comments are closed.
|
What is NYUD?
What is BPNYA?Archives
January 2020
Categories
All
|
 RSS Feed
