|
Market seems to be rebounding slowly, however the volume seems to be low. Remember, we are in middle of earnings season and market typically tends to be volatile, however by end of earnings season we may have confirmed market direction (hopefully)... What is below BPNYA chart tells us?
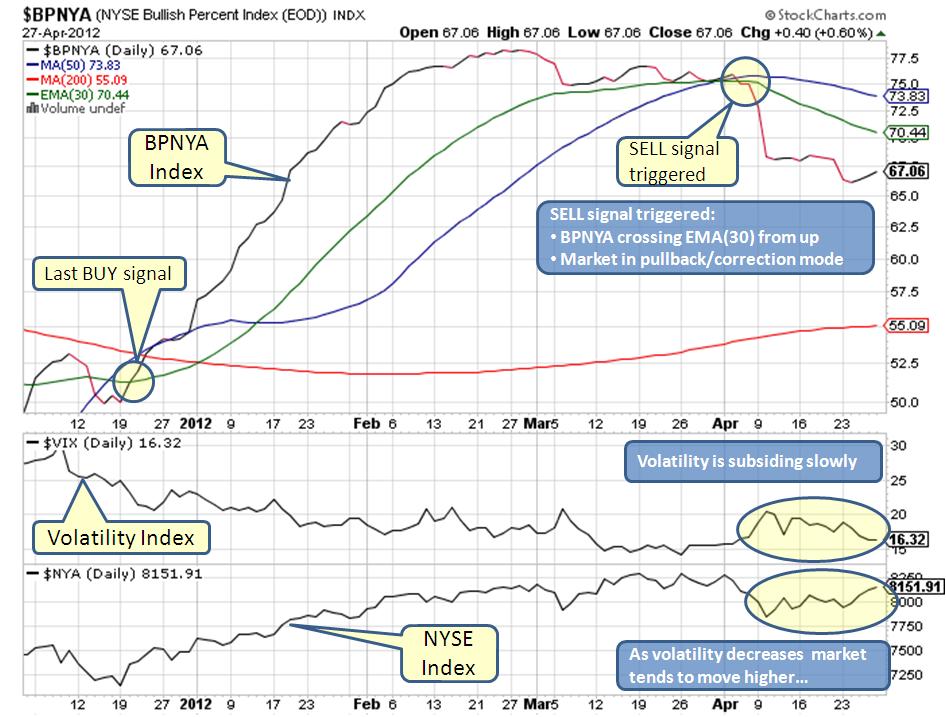
In most cases, when a rally started when BPNYA was between 60-70 mark then market could manage to make only 3-5% before entering deeper correction. Also historically month of May is not bullish as you might have heard the saying "Sell in May and Go Away".
What does this mean for our Investments? 401K portfolio: Be cautious and invest may be only 25% once we get BUY signal just to protect any major loss if we happen to get correction as you cannot get out quickly due to lock-in period. Stocks/ETFs: Trade ONLY good setups and always have STOP LOSS to avoid any major loss, never forget to check earnings date before entering stock positions. Good Luck trading!
andre
5/2/2012 01:22:27 am
Hi, can you please add the vix indicator to the link you have that takes us to stockcharts.com to see the daily bpnya chart? Thanks! Comments are closed.
|
What is NYUD?
What is BPNYA?Archives
January 2020
Categories
All
|
 RSS Feed
