|
Lots of talk in the media these days and bold statements made by many BUT what are the charts telling us? Lets understand the facts rather than illusion. Where is this market headed!!! BPNYA finally dropped below 70 mark, however our SELL signal was in effect from past two weeks. Volatility did spike earlier giving us a warning shot before it rose again which led the market towards pullback/correction. None of this should be a surprise to our readers as the charts did caution us way ahead of time. 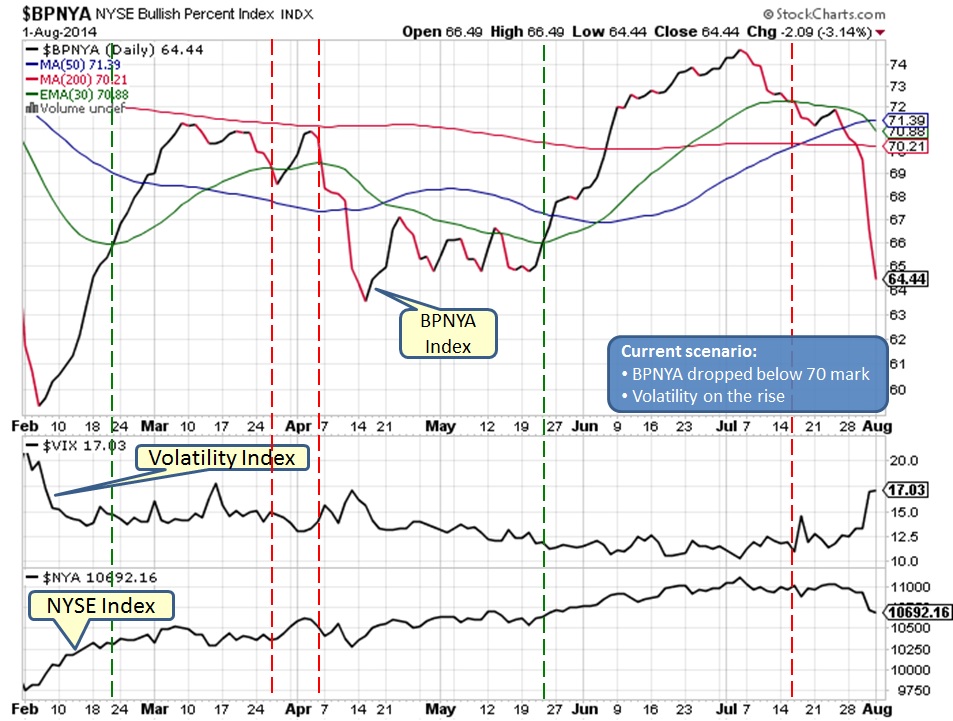
Market broke the MA(50) support on HIGH volume which was our clue to exit the market. Most likely it will test MA(200) support in coming weeks and expect a roller coaster ride ahead. 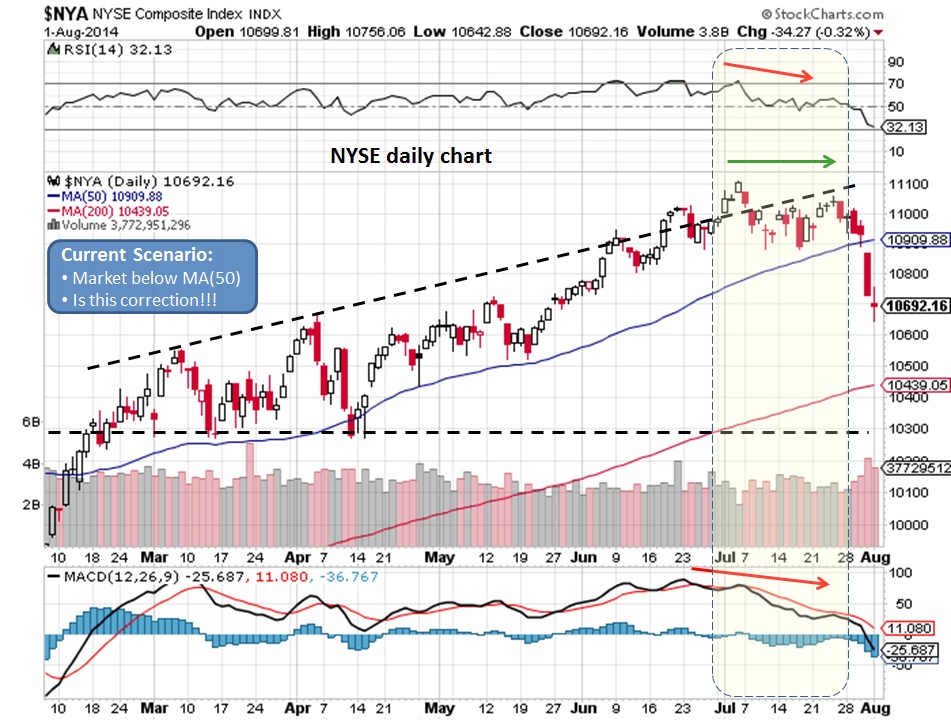
Weekly chart below was already showing us that RSI and MACD were not able to break through earlier HIGH suggesting that this market is most likely to go sideways or experience a pullback/correction. 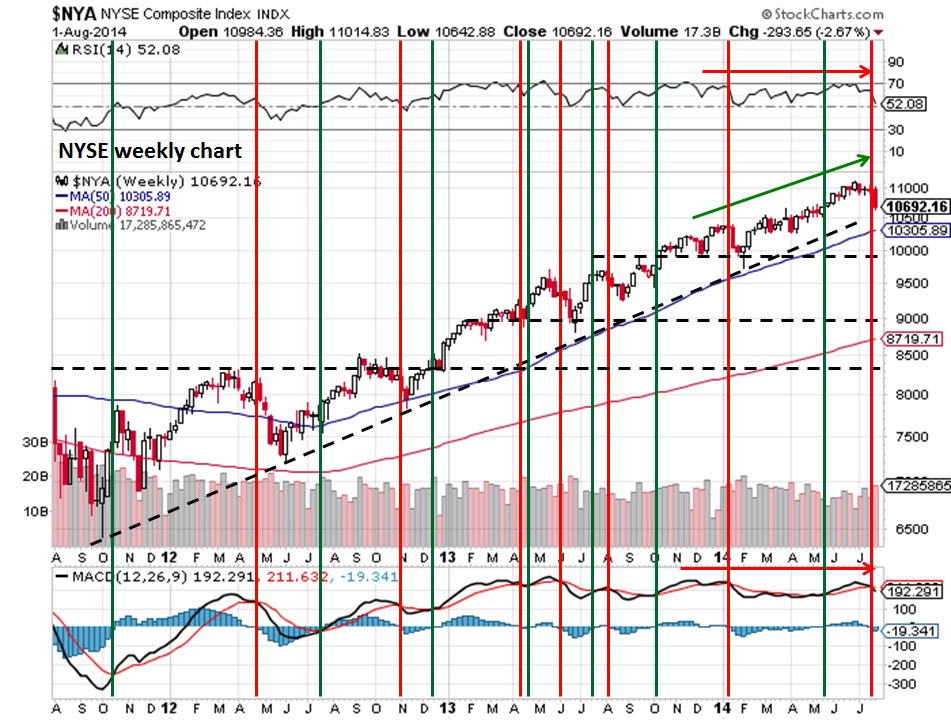
Finally, NYUD did snap back like a rubber band and closing in on EMA(21). It will not be a surprise to see it get pulled below EMA(21) briefly before rising again. This will allow market to test MA(200) and start the next meaningful bounce. 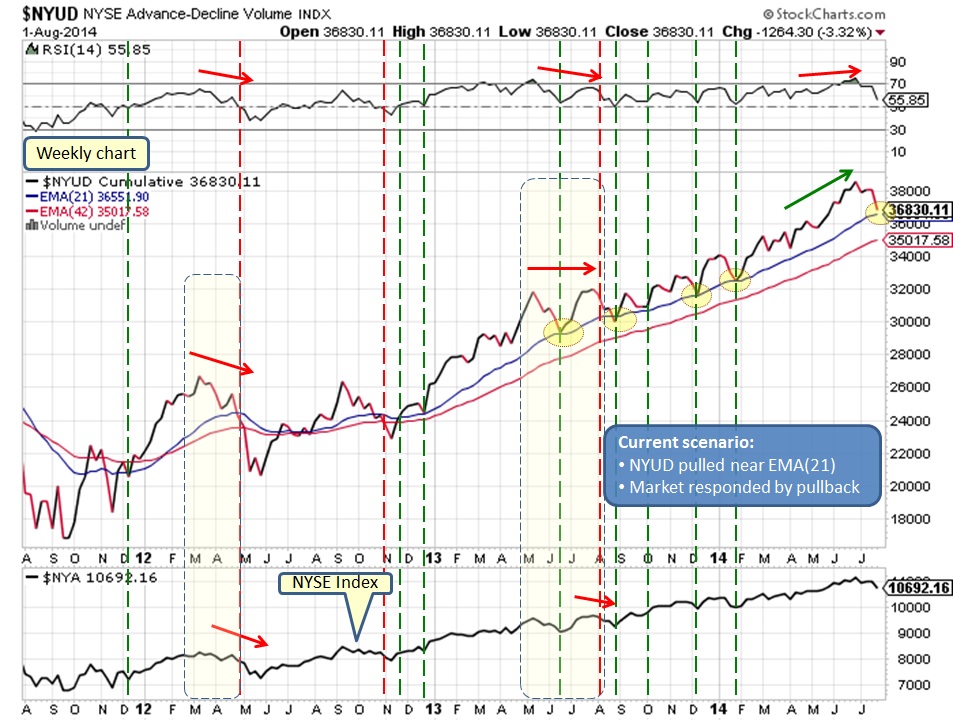
Market can spend next couple of weeks with wild swings in zig zag manner between MA(50) & MA(200) (due to geo-political tensions) before it can start any meaningful rally towards end of the year. This means now is the time to be cautious and wait for the next low risk entry with patience.
What does it mean for our Investments?
Market appears to have started a correction as of now. Comments are closed.
|
What is NYUD?
What is BPNYA?Archives
January 2020
Categories
All
|
 RSS Feed
