|
As expected market did drift down, however it has not yet marginally broken the lower low established in August. Let's see if charts are providing any guidance in this volatile situation. BPNYA continues to remain below EMA(30) while Volatility ($VIX) although subsiding is still above 20 mark. 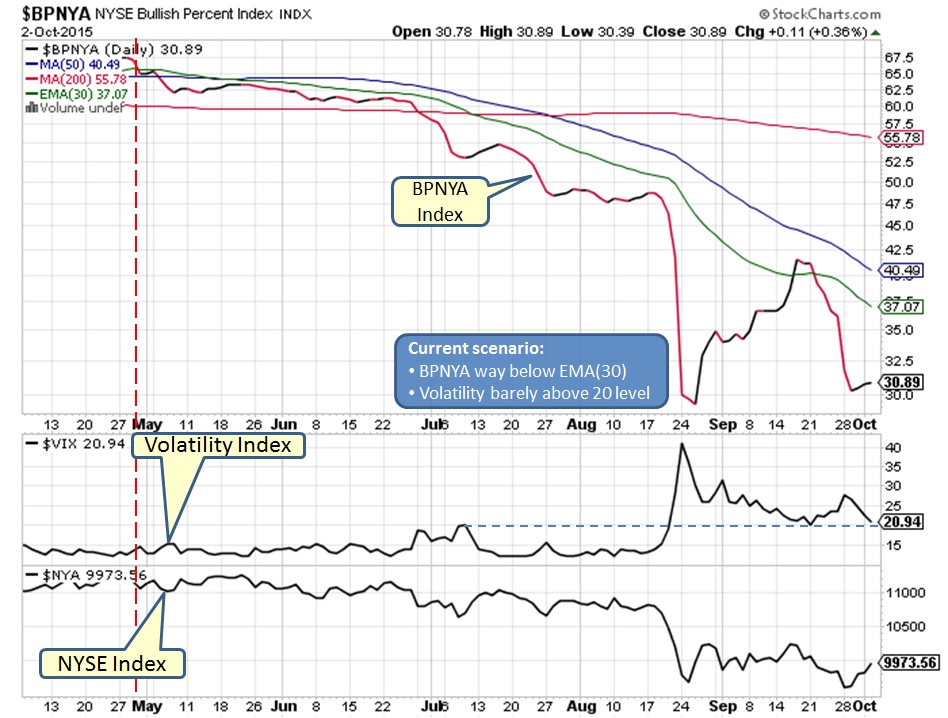 Daily NYSE chart below is displaying that market might bounce back temporarily, however we expect range bound action in very near term. Also watch out for MA(50) which may act as resistance. 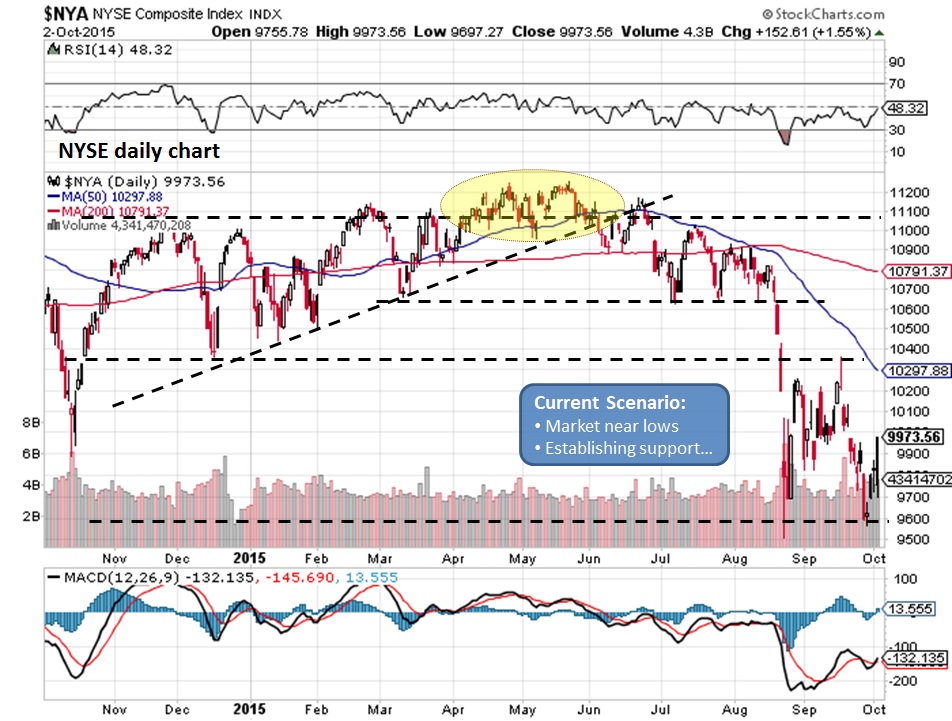 NYSE weekly chart clearly displays that market is currently at support and could continue remain in range for a while before any meaningful move outside the range. RSI is barely above oversold level while MACD continues to trend downwards. 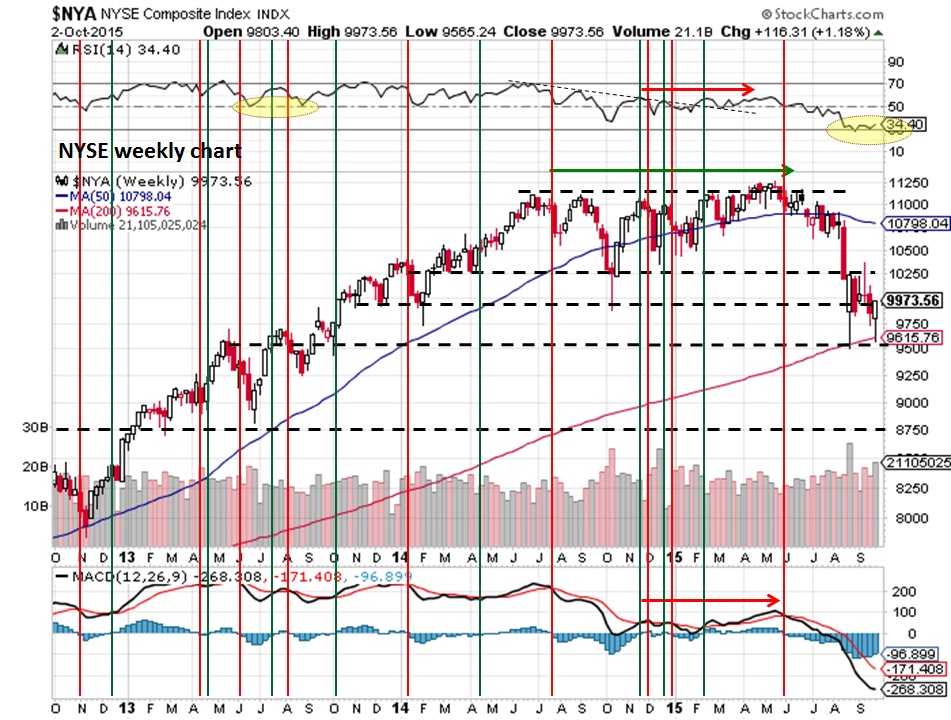 NYUD is way below EMA(21) and EMA(42) and for now is trending down deeply. 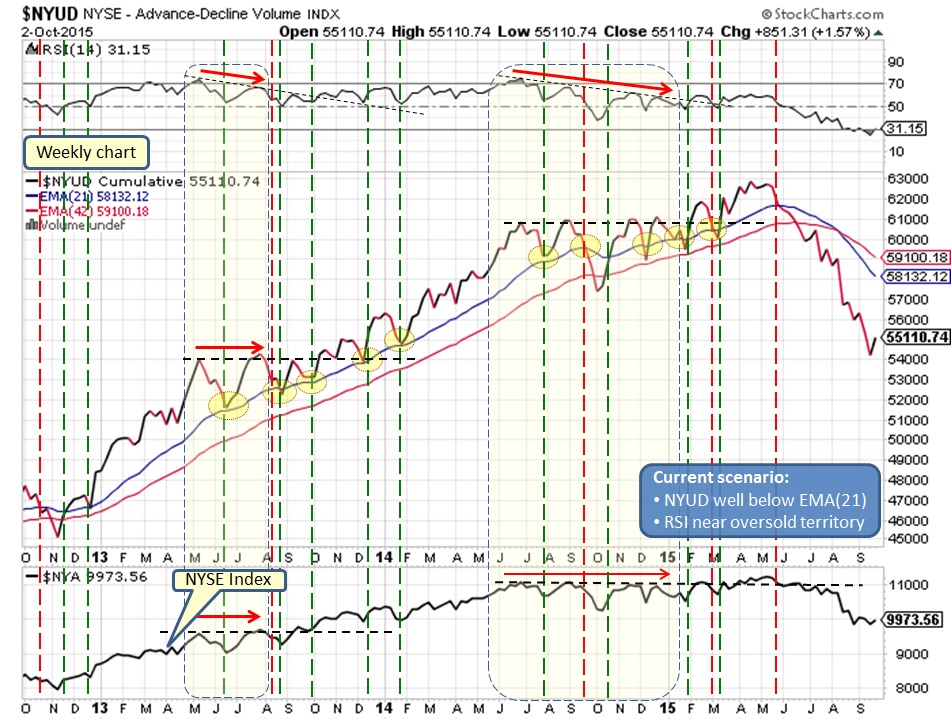 Charts are telling us that in short term we would be witnessing range bound action with wild swings in both directions and could take a while before this market establishes a sustained trend. It would be wise to take wait-n-watch approach for now.
What does it mean for our Investments?
Market remains in correction, stay on side lines... Comments are closed.
|
What is NYUD?
What is BPNYA?Archives
January 2020
Categories
All
|
 RSS Feed
