|
Market could not penetrate the resistance from earlier HIGH and appears to be breaking down. This could be start of something BIG for next several months. What can we expect next!!! BPNYA has crossed EMA(30) triggering SELL signal, also volatility ($VIX) rose rapidly which took the market down swiftly. 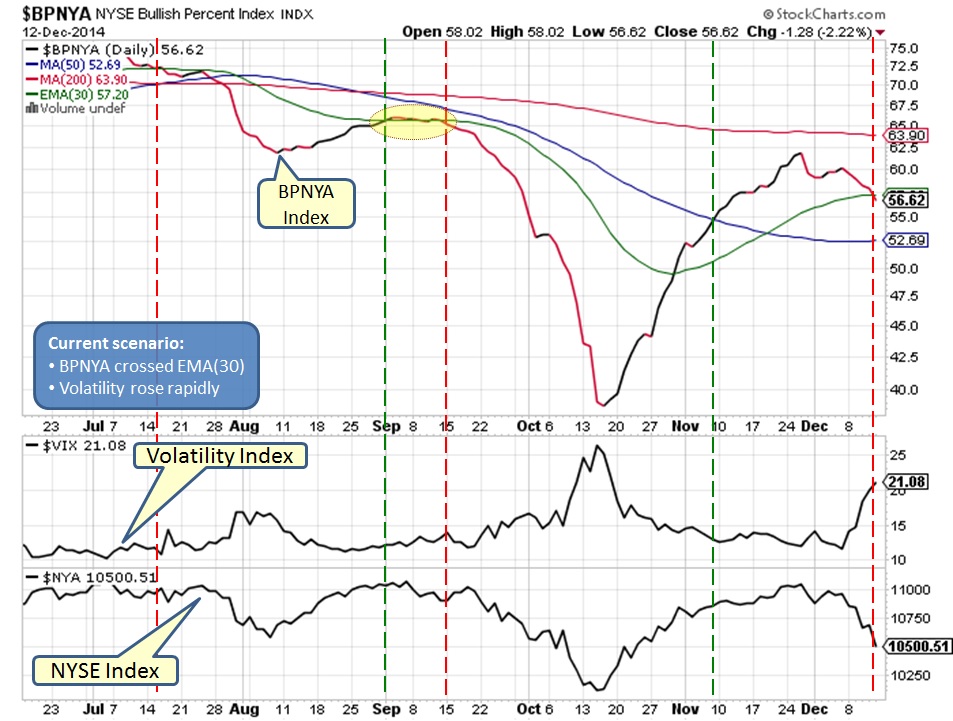
Daily NYSE chart shows that market could not find support near MA(50) or MA(200). Resistance near HIGH was strong hence market could not break through it. However, RSI is near oversold hence market may take another dip followed by a bounce as we saw in mid October. BUT the strength in the bounce remains to be seen. 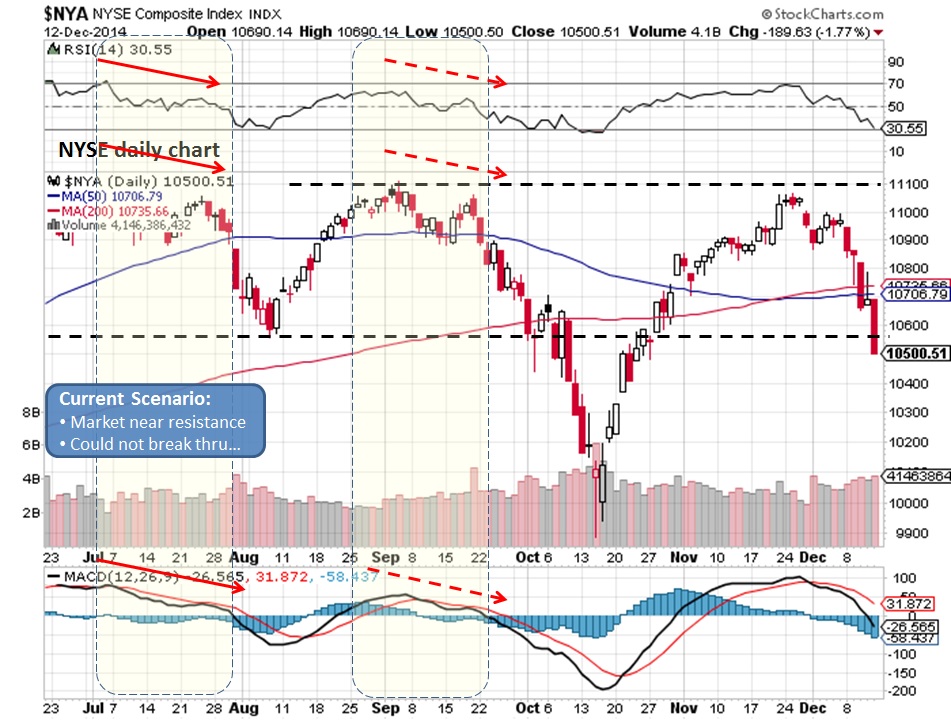
Weekly NYSE chart displays triple top with a possible support near 10000 area. RSI is below 50 mark and trending down while MACD is also trending down. 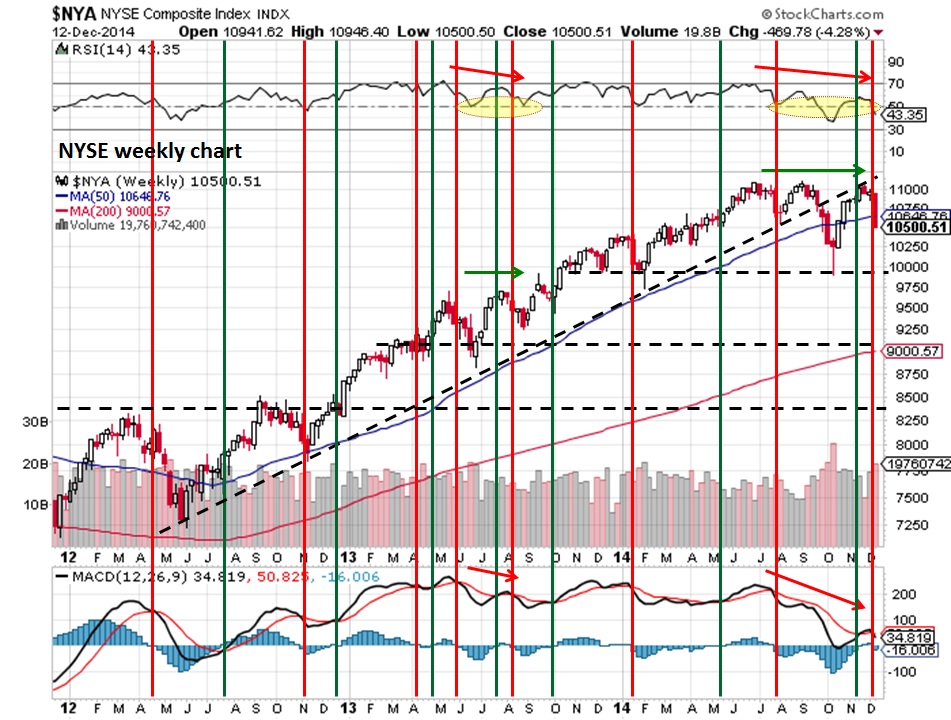
NYUD is probably providing the most relevant information regarding long term trend:
As a result, we can see NYSE is not able to make NEW HIGH and appears to be stagnated. 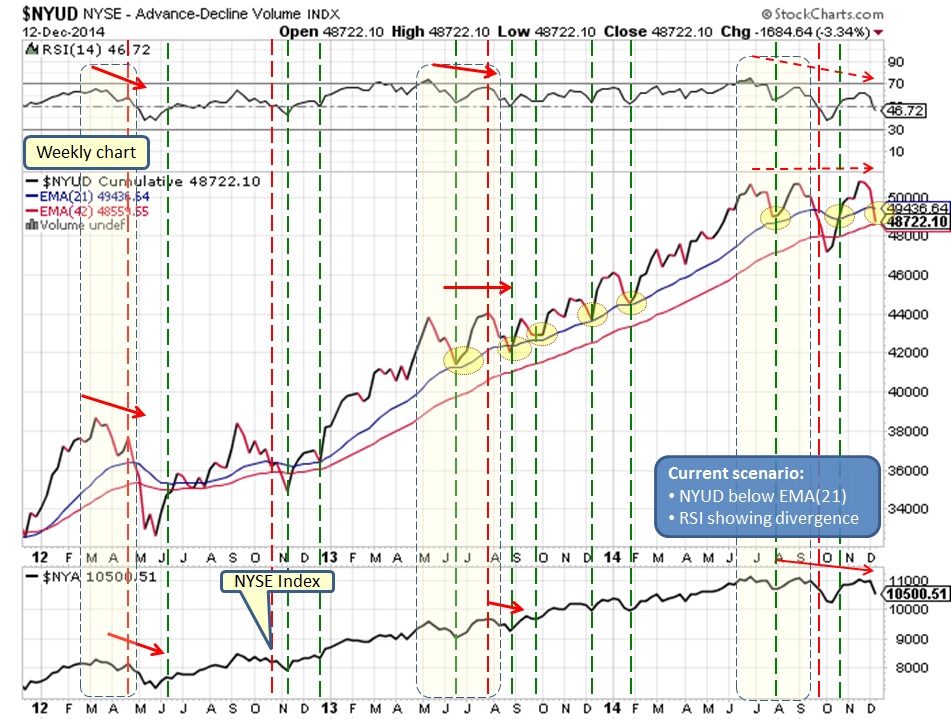
Based on the charts, it looks like market is undergoing long term trend change also known as topping pattern. Further decline in the market can be quick and dirty, marginally breaking the earlier low followed by a V-shape rally which might fizzle out soon. ONLY time will reveal the real story, but for now we can be prepared for a rough ride.
Comments are closed.
|
What is NYUD?
What is BPNYA?Archives
January 2020
Categories
All
|
 RSS Feed
