|
Last week, we did mention that entering market at that juncture is riskier and we see the results today. What will be market's next move? What are the charts telling us? BPNYA did trigger BUY signal by crossing EMA(30) upwards prior to last week, however at the time we did say that entering the markets now is bit riskier. As we can see in below chart, BPNYA and EMA(30) are flat and clinging to each other generating fuzzy BUY signal which is NOT reliable. Hence our conclusion was about correct. Also, Volatility is rising steadily which is dragging the market down. 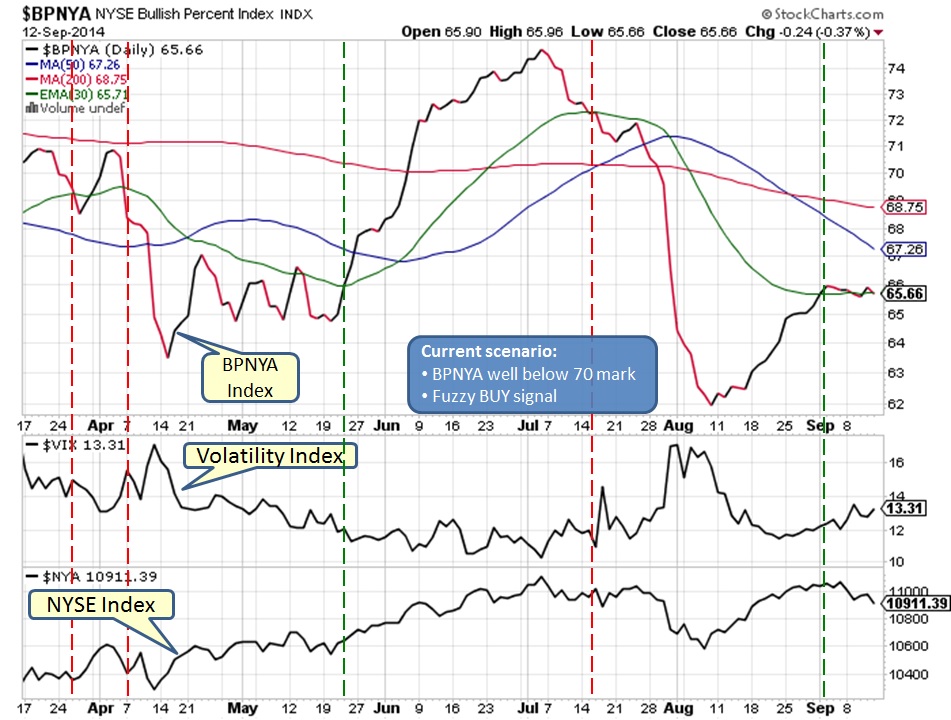
NYSE daily chart below is exhibiting DOUBLE TOP pattern in the formation. If market drops below MA(50) then its time to get out and stay on the sidelines. 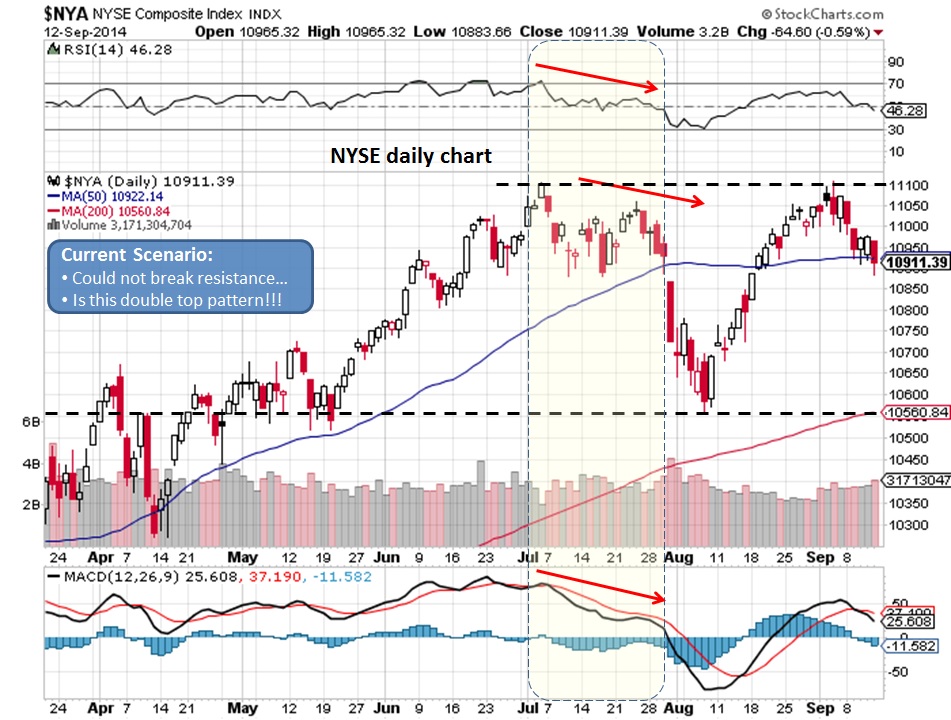
NYSE weekly chart helps to confirm our conclusions so far. RSI is trending down, MACD is trending down which is showing divergence with Price, also Price was not able to make a NEW HIGH. All signs suggest that we shall see further downside or sideways action in the market but WHY? Check out similar earlier period during 2013 and you shall have your answer (shown with arrows in below chart). However, RSI is not below 50 yet! 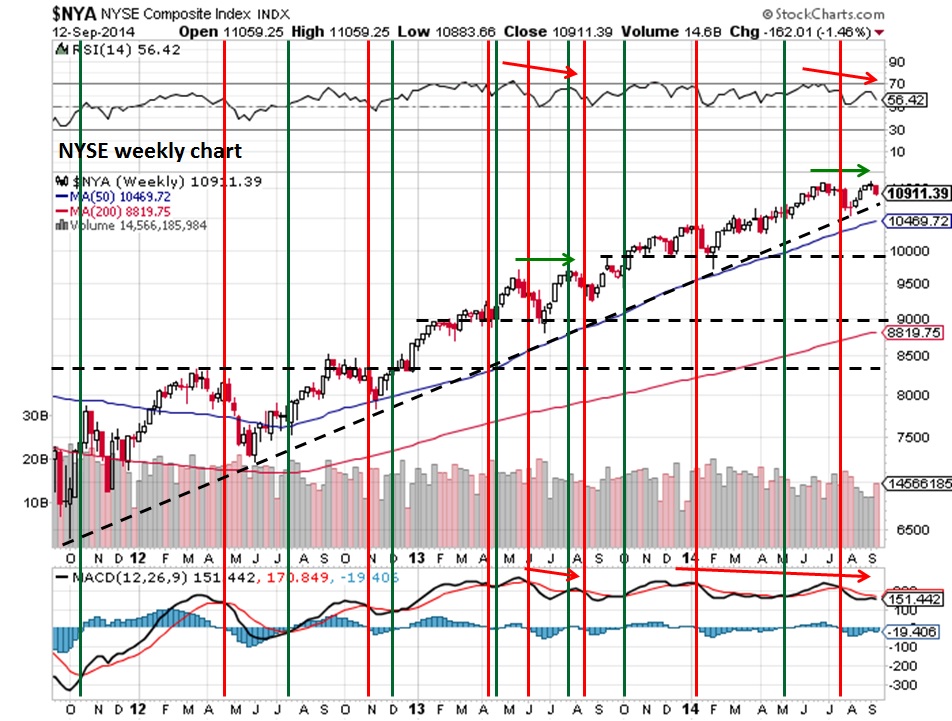
NYUD seems to confirm our understanding from above charts, how-come!!! RSI trending down and NYUD could not make a NEW HIGH which means we shall see a pullback in the market just the way we saw during 2013 Aug-Sept. 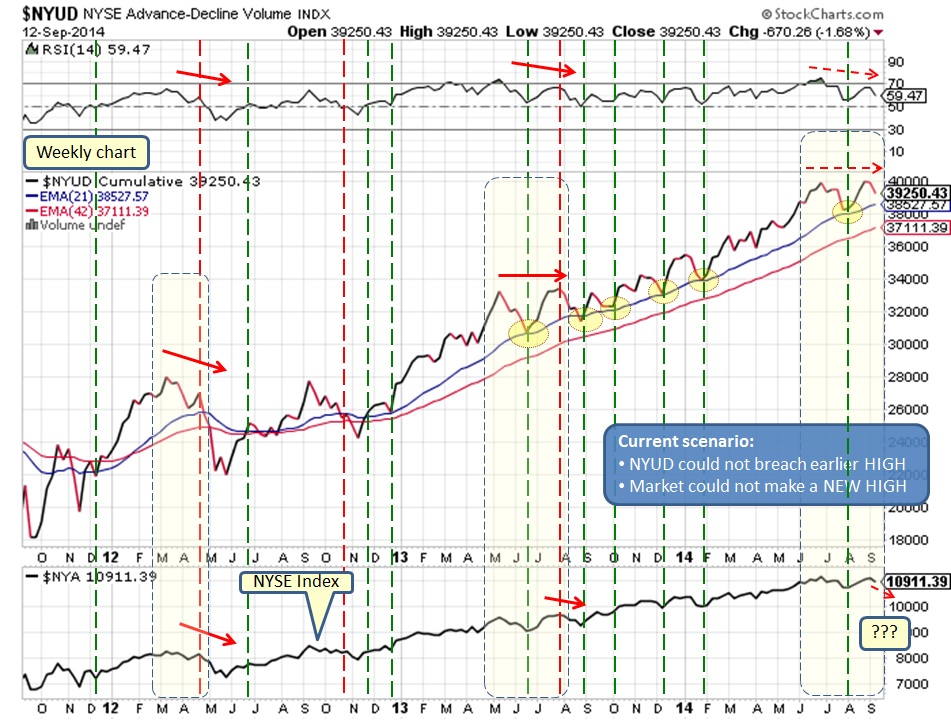
Based on all the information we have at hand, it appears that market shall experience pullback or sideways action for the next 2-3 weeks BUT will it become a meaningful correction or just a shallow pullback remains to be seen. As long as NYUD remains above EMA(21) the pullback shall remain shallow. Next week, we have FED meeting which shall add more volatility to the market along with on-going geo-political events. Its better to remain cautious for now.
What does it mean for our Investments?
Market remains in BULL trend but be cautious... Comments are closed.
|
What is NYUD?
What is BPNYA?Archives
January 2020
Categories
All
|
 RSS Feed
