|
Market managed a V-shaped recovery and back to same levels as mid January 2014 challenging old HIGHs. Can we expect the rally to continue higher and if so then how far will it go!!! What should we expect in near term? BPNYA gave a BUY signal last week when BPNYA crossed EMA(30) upwards suggesting bullish market. Volatility is subsiding which is helping market to steadily climb higher. 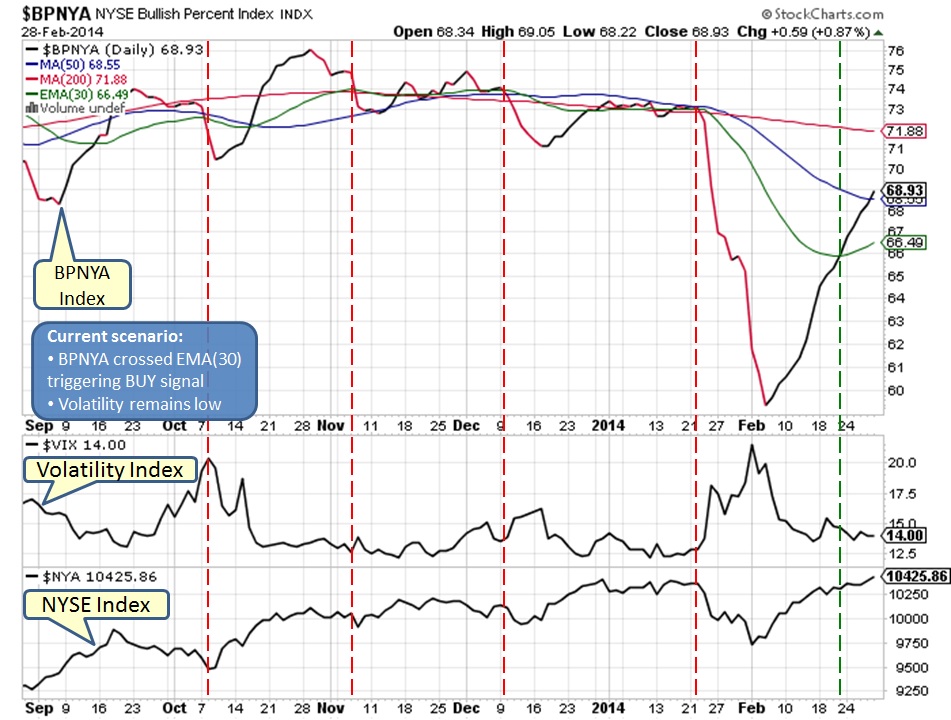
On daily chart below, the dotted trend line can act as resistance which in turn will allow market to pullback or sideways action. Such an action will be healthy for this rally suggesting further gains ahead. 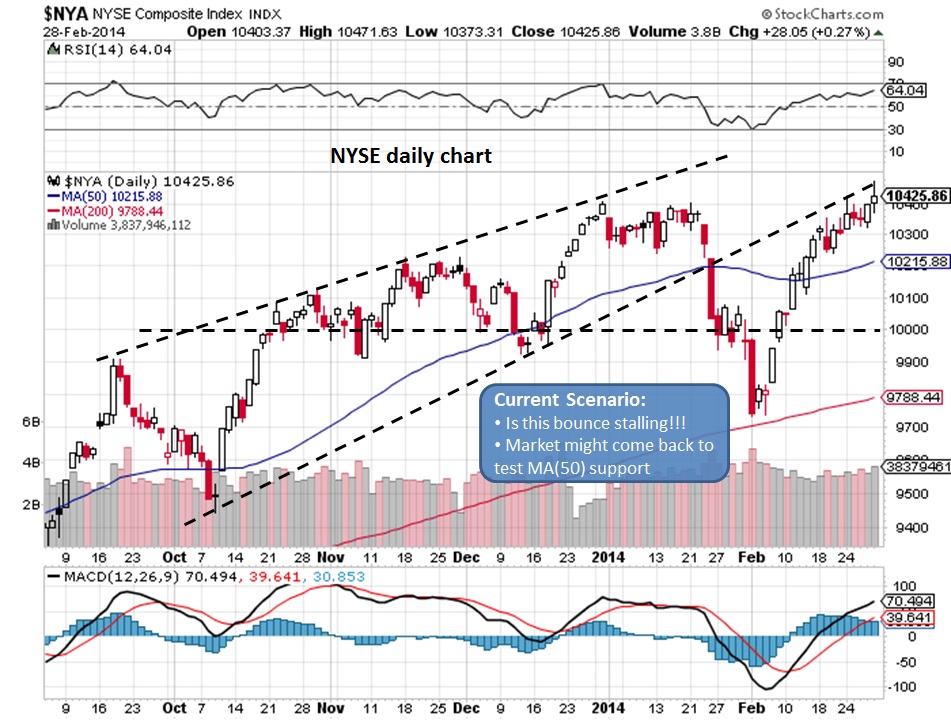
On weekly chart, market is challenging OLD HIGHs but divergence still remains into play. ONLY time will tell when this divergence will be resolved as there is absolutely NO way to identify the timing. 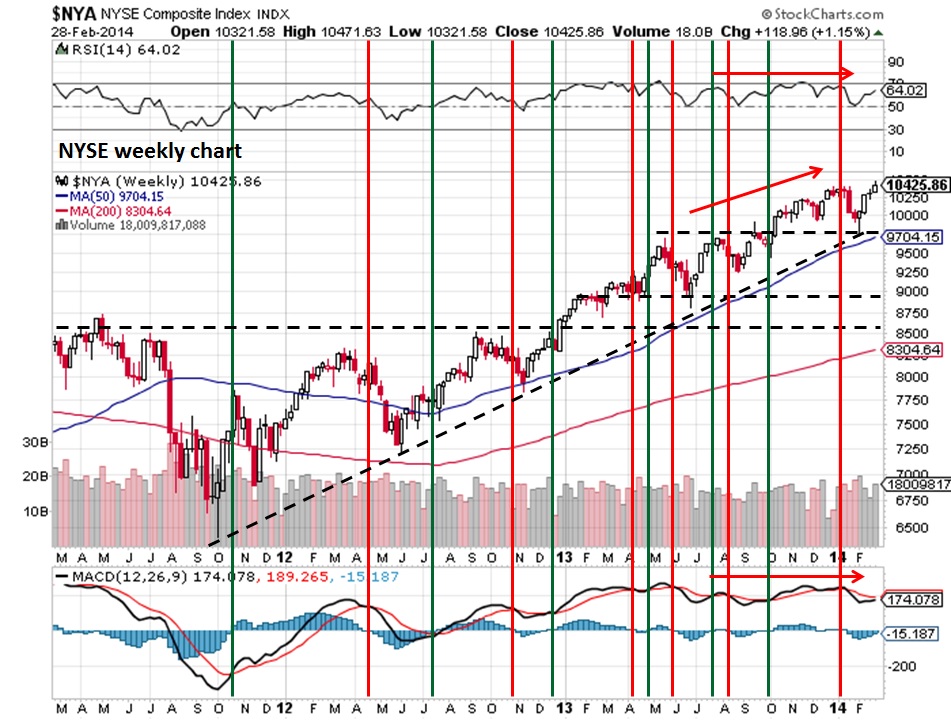
Below NYUD (advancing & declining volume breadth) weekly chart has successfully managed to take out the earlier HIGH which is bullish for the market and suggest that price action is supported by volume. 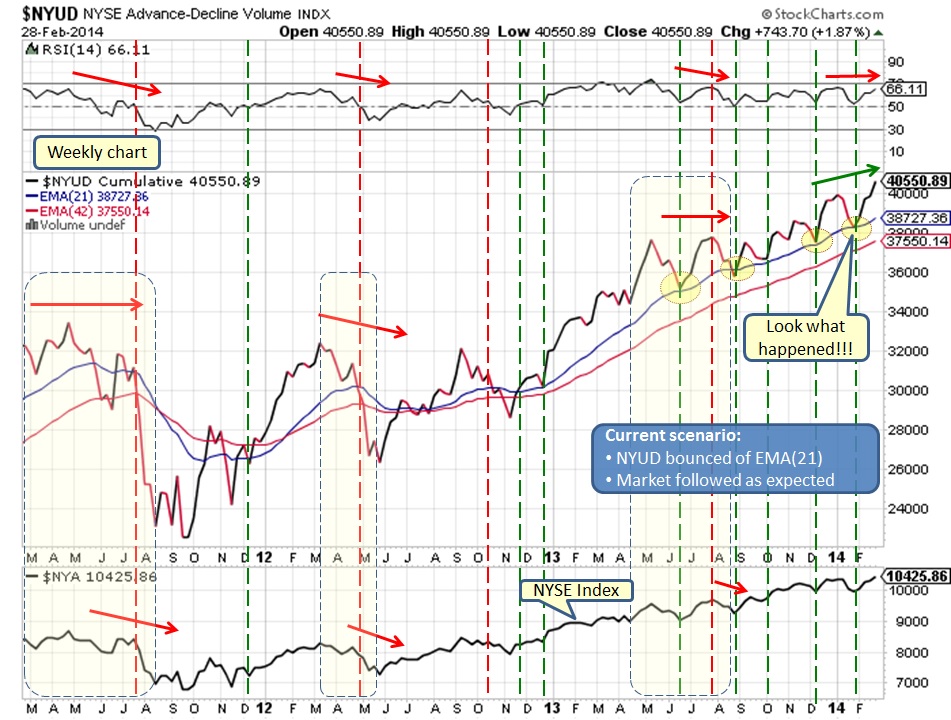
Based on what charts are telling us, it seems like we might get a minor pullback or sideways action after a nice V-shape rally which can be considered healthy for this rally. However, we should not forget that divergence suggest that at some point in future we are prone to see a BIGGER pullback/correction BUT we are NOT there yet.
What does it mean for our Investments?
Market remains bullish for now... Comments are closed.
|
What is NYUD?
What is BPNYA?Archives
January 2020
Categories
All
|
 RSS Feed
