|
Market ran into resistance from earlier HIGH and reversed. This was not a surprise at all and we did expect it. Does it mean the rally is over? What are charts telling us? We will keep our post concise during month of December and at times our post might get delayed, we will appreciate your patience. BPNYA well above EMA(30) hence NO SELL signal is triggered yet. Volatility ($VIX) although low as of now appears to be turning around, keep an eye on it. 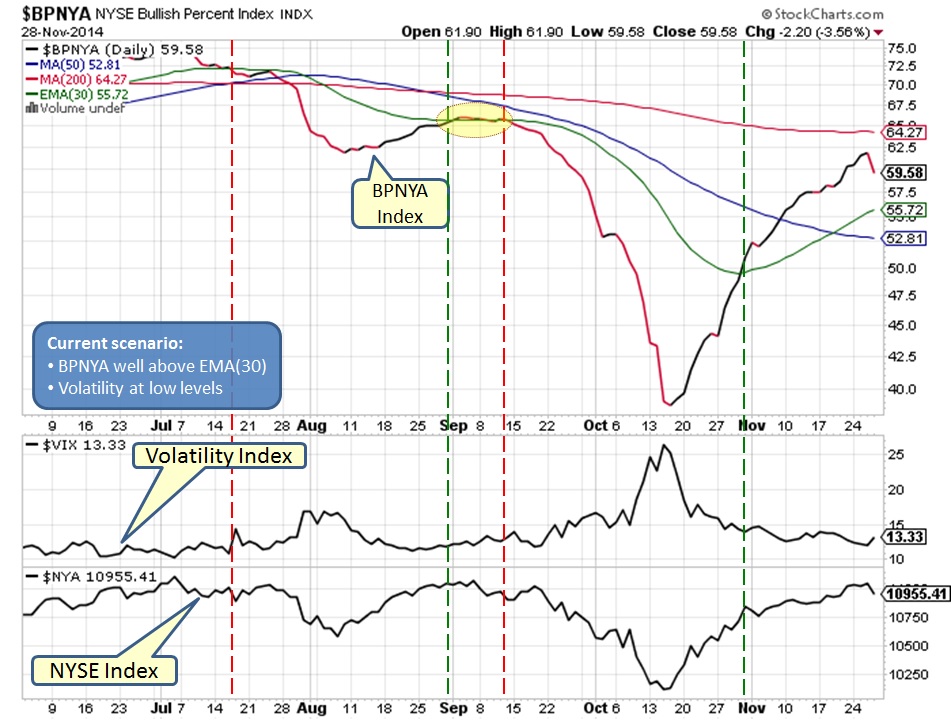
NYSE daily chart clearly shows, market ran into resistance. Will this pullback be short lived or something bigger remains to be seen. Next support can be expected near 10900 area along with MA(200) & MA(50) lines. 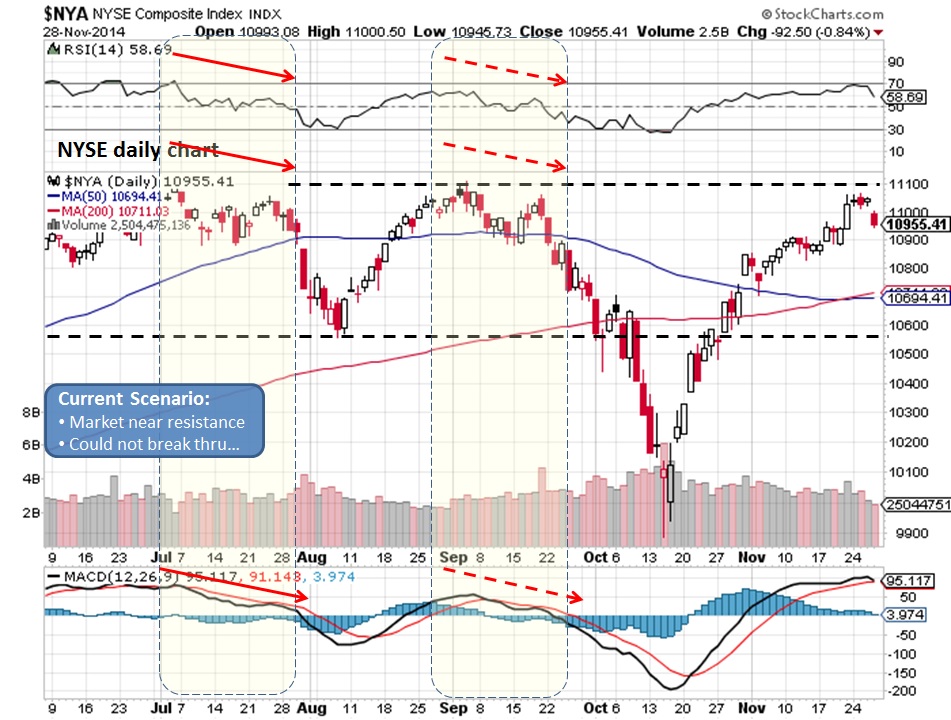
Weekly NYSE chart is NOT giving clear direction, why?
In short, we are getting mixed signals and next few weeks shall clear the muddy waters. 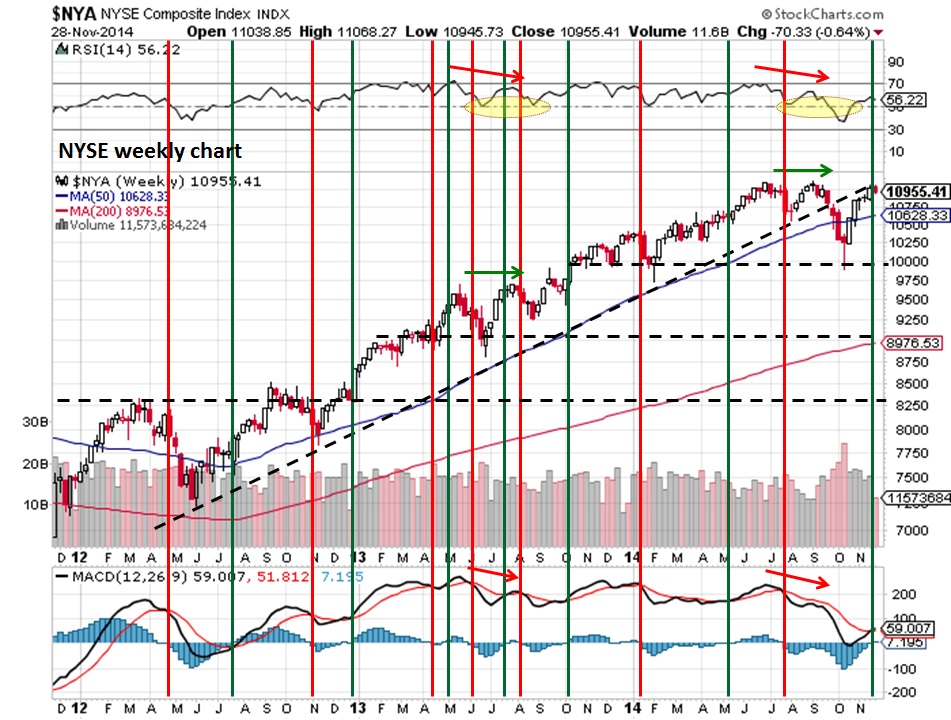
NYUD is also providing subtle changes:
As long as NYUD remains above EMA(21), bulls get benefit of doubt. 
Based on current charts, it appears that market might be on the verge or make it or break it. We shall get a better picture in next two weeks which shall provide a better market direction. Stay cautious for now, however bulls get benefit of doubt based on charts.
12/8/2014 08:38:56 pm
The resistance of Nifty is shows around 8560 after breaking this level it will show the level around 8650. Comments are closed.
|
What is NYUD?
What is BPNYA?Archives
January 2020
Categories
All
|
 RSS Feed
