|
We hope you controlled the temptation of getting back in the market when it was making new HIGH's. Last week we saw the first sign of possible correction ahead. As earnings season is unwinding, we shall expect more zig-zag action and probably a meaningful correction on the horizon. Really!!! On what basis we determine that!!! As we can see from below chart, BPNYA is finally below 70 mark. It stayed above that mark for close to three months, however it did gave us enough warning signs to get out of market. Also in bottom portion of the chart, it is clear that volatility appears to be rising and if it continues to rise then it shall drag down the market further. 
Daily NYSE chart shows that market is below MA(50) line and it might be possible start of a correction. This does not mean that market will not make an attempt for another rally, however probability is low. 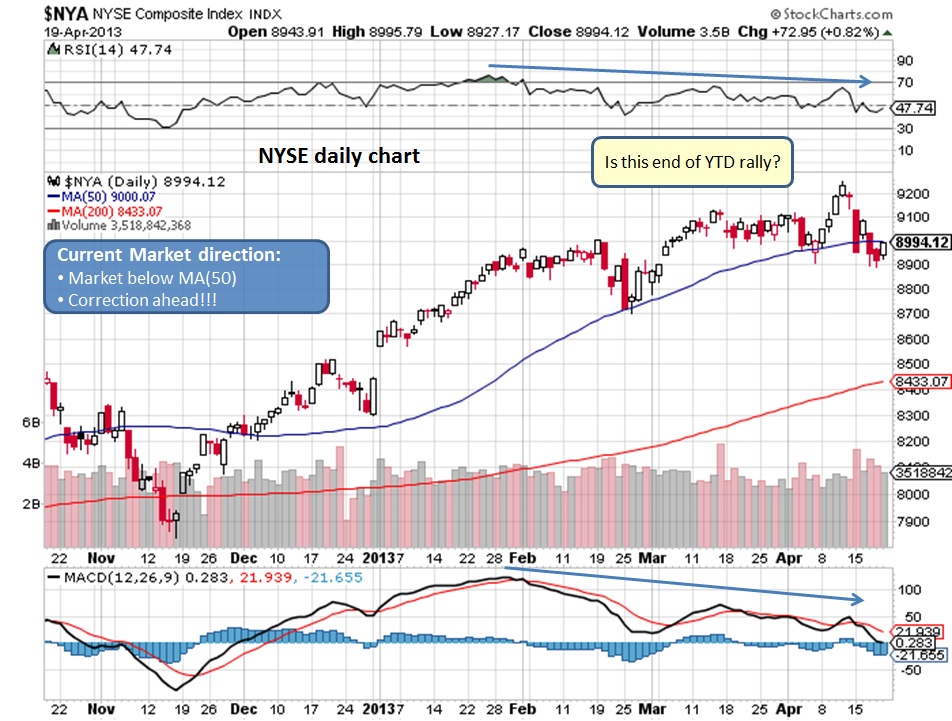
On weekly NYSE chart below in bottom portion, we can see that MACD line appears to be crossing red line which shall also signify start of correction. 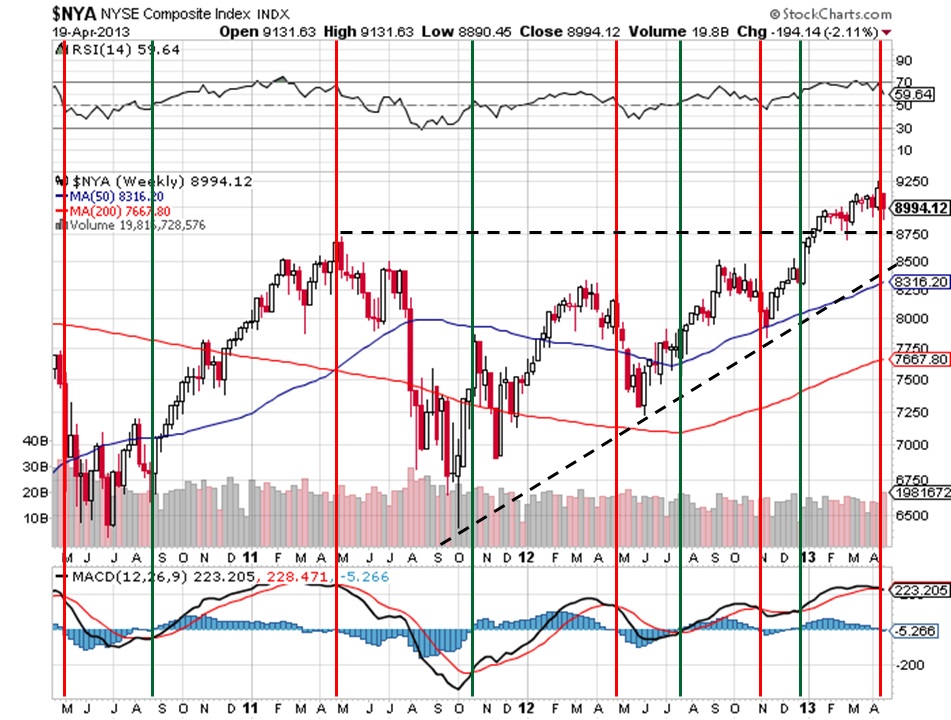
What does it mean for our Investments?
Market on verge of trend change, be cautious... Comments are closed.
|
What is NYUD?
What is BPNYA?Archives
January 2020
Categories
All
|
 RSS Feed
