|
Our apologies for not posting last weekend due to site related issues. We hope everybody had a wonderful Christmas and wish you all a safe and prosperous New Year ahead. Market is near earlier HIGHs and might experience resistance here. Will it gain enough strength to break through or will it roll over!!! BPNYA has moved back above EMA(30) while volatility ($VIX) is subsiding. Considering current scenario and BPNYA behavior of crossing EMA(30) in both direction in such short time frame is providing fuzzy signals. 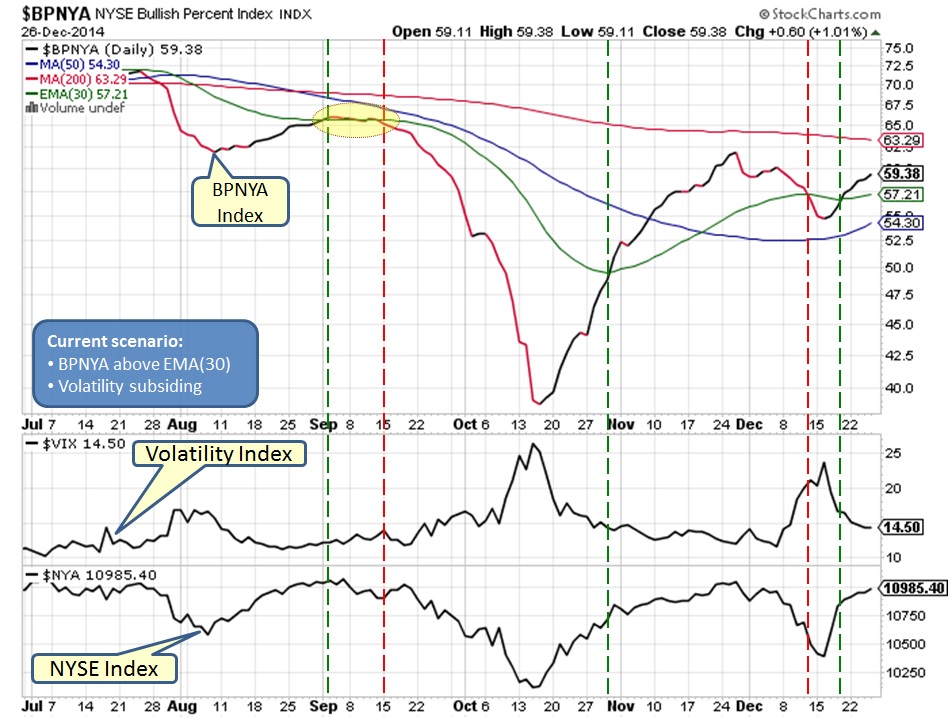
NYSE daily chart is telling us that market is back near resistance from earlier HIGH. Unless market breaks the resistance area of 11100 decisively, it might end up moving in a range. 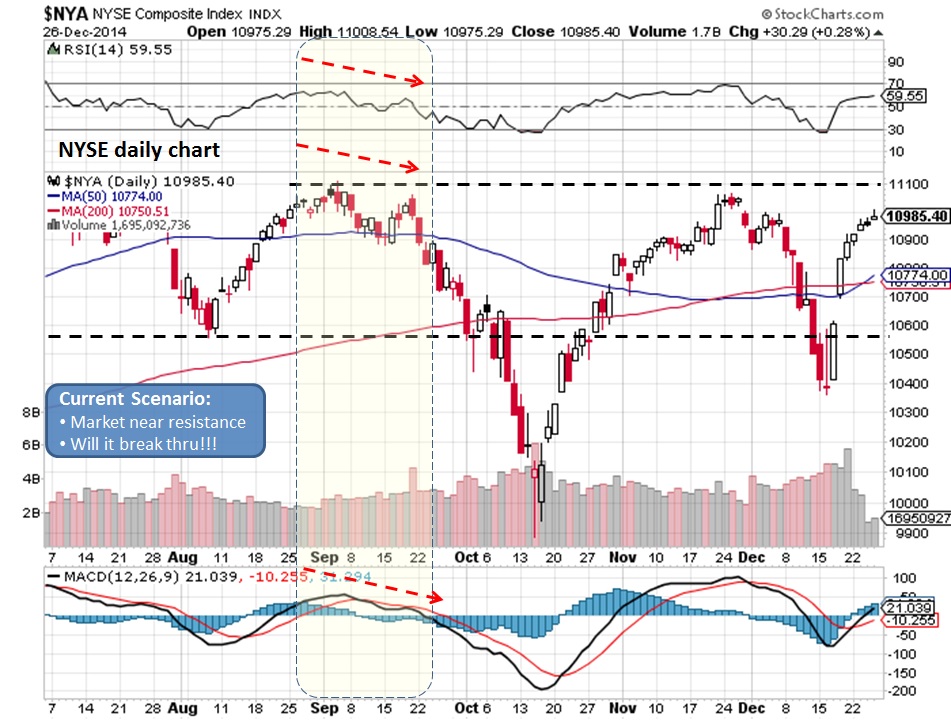
Weekly NYSE chart is showing triple top pattern, however RSI is above 50 mark giving benefit of doubt to BULLs. 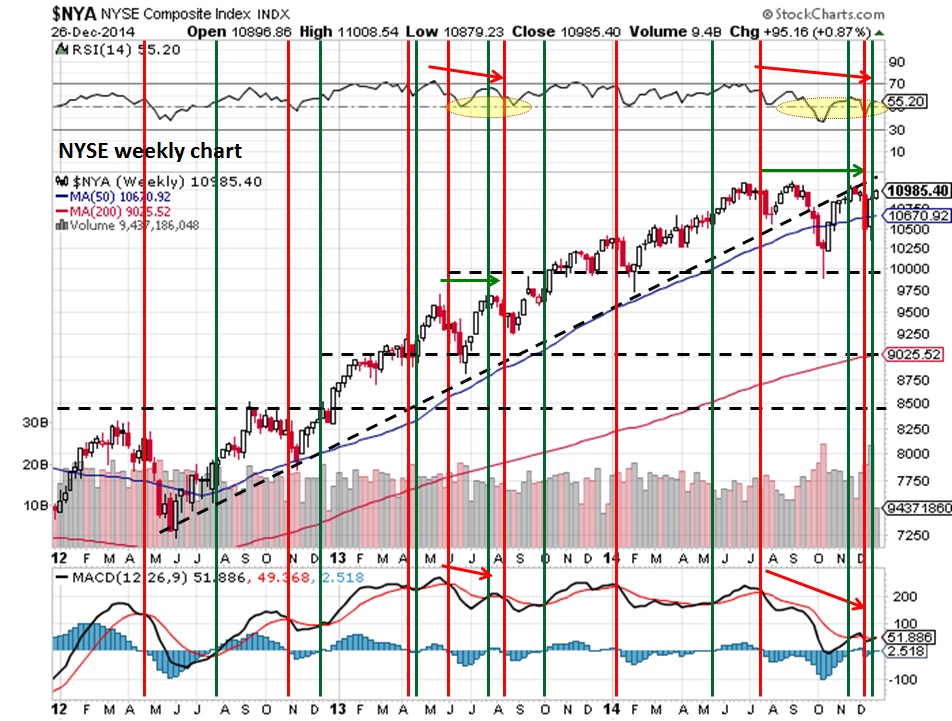
NYUD is above EMA(21) and trying to make a NEW HIGH which would be bullish sign, also RSI is above 50 mark suggesting bullish signs. However, lets not forget the divergence between RSI and NYUD. 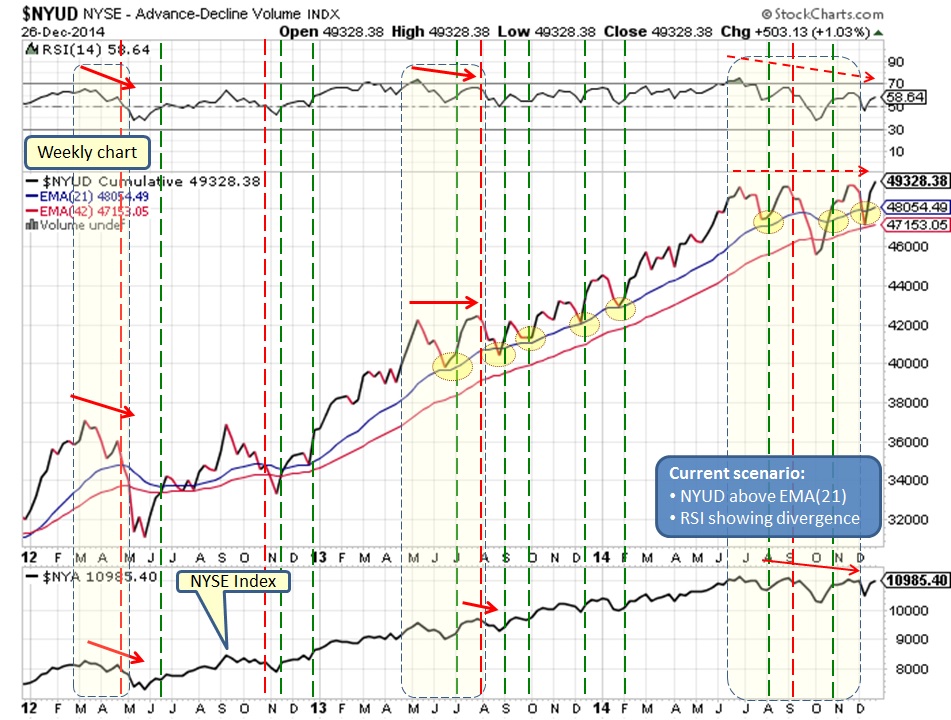
Charts are telling us that benefit of doubt goes to BULLs but also gives us subtle warning signs to be cautious. If this market makes a NEW HIGH in coming days/weeks then this rally still has legs.
What does it mean for our Investments?
Market BULLs get benefit of doubt for now... Comments are closed.
|
What is NYUD?
What is BPNYA?Archives
January 2020
Categories
All
|
 RSS Feed
