|
Market has managed to stage an impressive rally from last months low but can this turn into the next BULL run!!! Strong resistance looms overhead and overcoming it will not be easy. Are charts providing any clues!!! Current rally was expected as shown by arrows in below chart. RSI has yet to reach overbought level which in turn means market has some more room to run. Expect strong resistance near 10200 area visible in below chart. 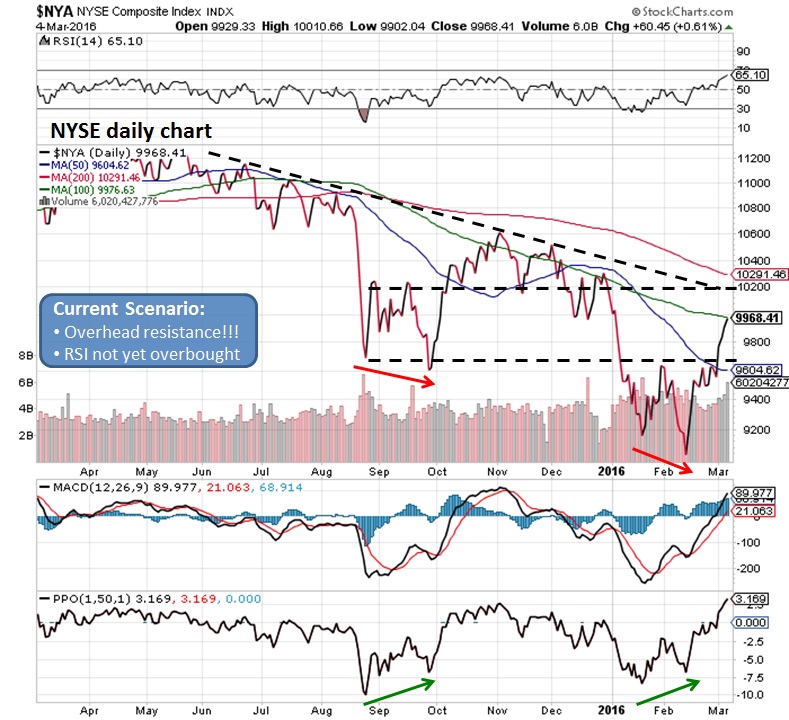 Weekly chart suggest that series of overhead resistance will need strong market catalyst to break through, however in short term current rally might soon experience resistance. Watch RSI which appears to be near breaking out of downtrend line and also possibly move above 50 mark. 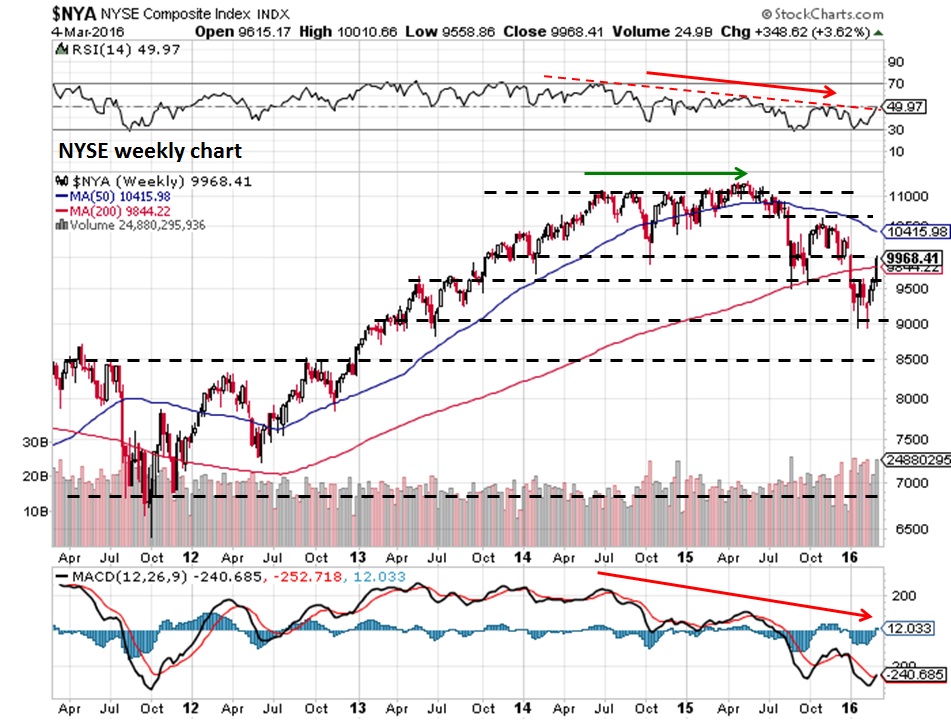 NYUD has finally managed to move above EMA(21) while RSI has broken out of downtrend line and move above 50 mark. Now NYUD needs to march above EMA(42) to consider that this rally is for real. 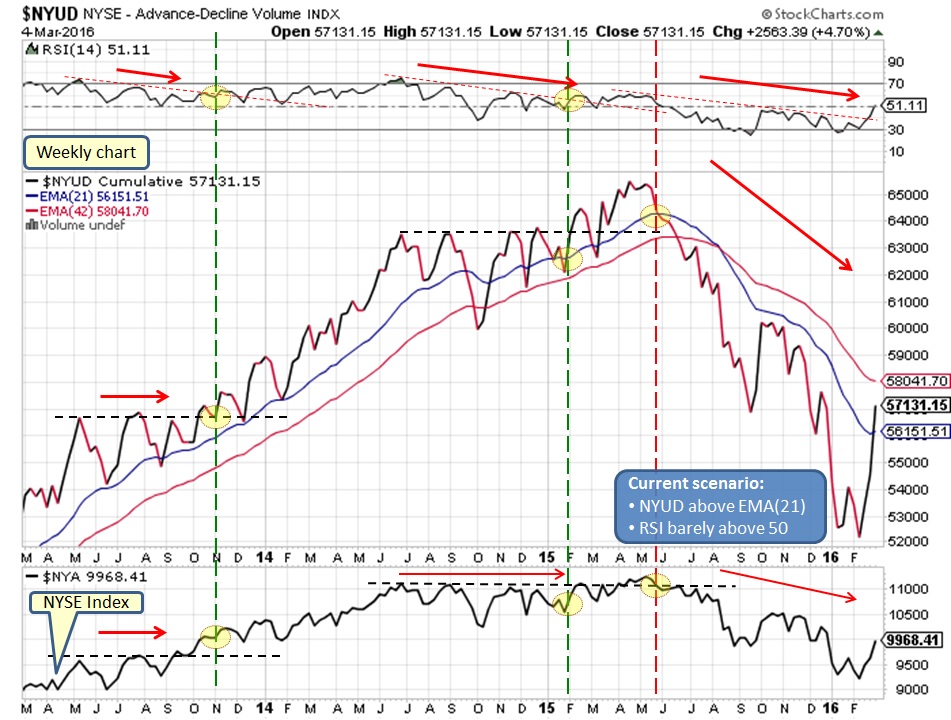 McClellan Summation Index continues to remain below EMA(59) and needs to move above it for this market to continue this BULL rally. 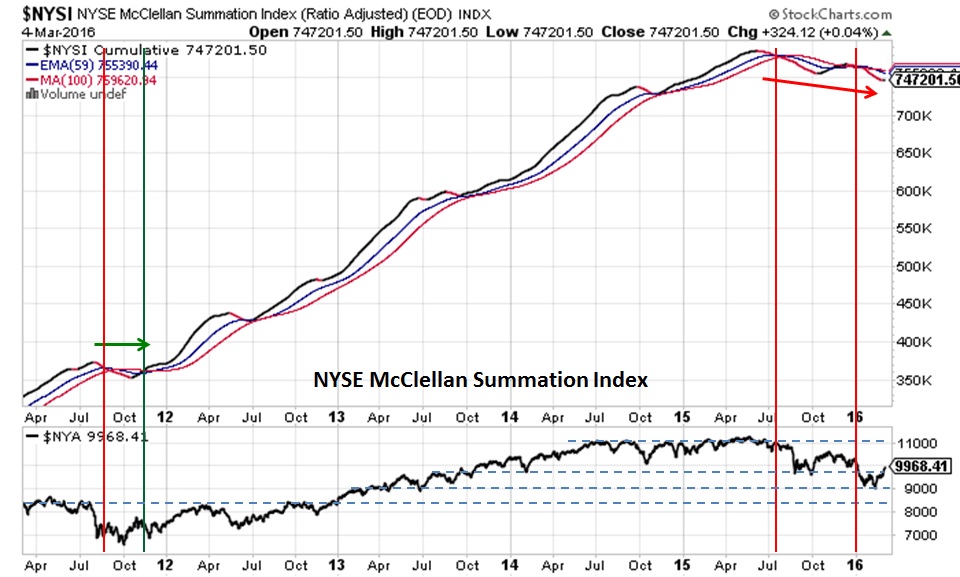 Charts are telling us that this market will need lot of strength to overcome strong overhead resistance which in turn means this market needs a strong catalyst for strong move higher. We remain skeptical that this rally is sustainable and shall fizzle out in couple of weeks.
What does it mean for our Investments?
Bounce continues to hold but watch out... Comments are closed.
|
What is NYUD?
What is BPNYA?Archives
January 2020
Categories
All
|
 RSS Feed
